
Page 421 - Mechanical Behavior of Materials
P. 421
422 Chapter 9 Fatigue of Materials: Introduction and Stress-Based Approach
50
S a , Stress Amplitude, MPa 200 7075-T6 Al 200 7075-T6 Al 30 S a
300
300
(a)
(b)
40
S =0
m
k =1
t
ksi
20
S =0
m
k =1
t
100
100
10
0 10 20 30 40x10 6 10 4 10 5 10 6 10 7 10 8
N , Cycles to Failure N , Cycles to Failure
f
f
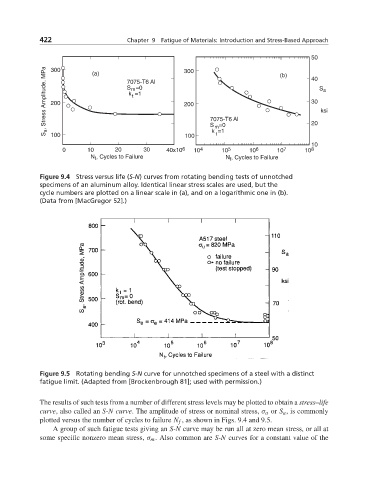
Figure 9.4 Stress versus life (S-N) curves from rotating bending tests of unnotched
specimens of an aluminum alloy. Identical linear stress scales are used, but the
cycle numbers are plotted on a linear scale in (a), and on a logarithmic one in (b).
(Data from [MacGregor 52].)
Figure 9.5 Rotating bending S-N curve for unnotched specimens of a steel with a distinct
fatigue limit. (Adapted from [Brockenbrough 81]; used with permission.)
The results of such tests from a number of different stress levels may be plotted to obtain a stress–life
curve, also called an S-N curve. The amplitude of stress or nominal stress, σ a or S a , is commonly
plotted versus the number of cycles to failure N f , as shown in Figs. 9.4 and 9.5.
A group of such fatigue tests giving an S-N curve may be run all at zero mean stress, or all at
some specific nonzero mean stress, σ m . Also common are S-N curves for a constant value of the