
Page 422 - Mechanical Behavior of Materials
P. 422
Section 9.2 Definitions and Concepts 423
stress ratio, R. Although stresses are usually plotted as amplitudes, σ or σ max are sometimes plot-
ted instead. Equations 9.2 and 9.4 can be used to convert S-N curves plotted in one form to another.
The number of cycles to failure changes rapidly with stress level and may range over several
orders of magnitude. For this reason, the cycle numbers are usually plotted on a logarithmic scale.
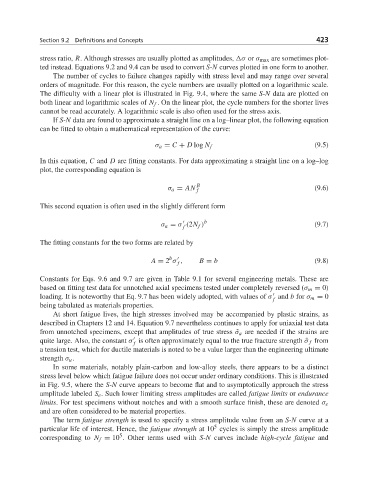
The difficulty with a linear plot is illustrated in Fig. 9.4, where the same S-N data are plotted on
both linear and logarithmic scales of N f . On the linear plot, the cycle numbers for the shorter lives
cannot be read accurately. A logarithmic scale is also often used for the stress axis.
If S-N data are found to approximate a straight line on a log–linear plot, the following equation
can be fitted to obtain a mathematical representation of the curve:
σ a = C + D log N f (9.5)
In this equation, C and D are fitting constants. For data approximating a straight line on a log–log
plot, the corresponding equation is
σ a = AN B f (9.6)
This second equation is often used in the slightly different form
σ a = σ (2N f ) b (9.7)
f
The fitting constants for the two forms are related by
b
A = 2 σ , B = b (9.8)
f
Constants for Eqs. 9.6 and 9.7 are given in Table 9.1 for several engineering metals. These are
based on fitting test data for unnotched axial specimens tested under completely reversed (σ m = 0)
loading. It is noteworthy that Eq. 9.7 has been widely adopted, with values of σ and b for σ m = 0
f
being tabulated as materials properties.
At short fatigue lives, the high stresses involved may be accompanied by plastic strains, as
described in Chapters 12 and 14. Equation 9.7 nevertheless continues to apply for uniaxial test data
from unnotched specimens, except that amplitudes of true stress ˜σ a are needed if the strains are
quite large. Also, the constant σ is often approximately equal to the true fracture strength ˜σ f from
f
a tension test, which for ductile materials is noted to be a value larger than the engineering ultimate
strength σ u .
In some materials, notably plain-carbon and low-alloy steels, there appears to be a distinct
stress level below which fatigue failure does not occur under ordinary conditions. This is illustrated
in Fig. 9.5, where the S-N curve appears to become flat and to asymptotically approach the stress
amplitude labeled S e . Such lower limiting stress amplitudes are called fatigue limits or endurance
limits. For test specimens without notches and with a smooth surface finish, these are denoted σ e
and are often considered to be material properties.
The term fatigue strength is used to specify a stress amplitude value from an S-N curve at a
5
particular life of interest. Hence, the fatigue strength at 10 cycles is simply the stress amplitude
5
corresponding to N f = 10 . Other terms used with S-N curves include high-cycle fatigue and