
Page 427 - Mechanical Behavior of Materials
P. 427
428 Chapter 9 Fatigue of Materials: Introduction and Stress-Based Approach
Hence, for the Eq. 9.6 form of stress–life curve, a given safety factor in stress corresponds to a
particular safety factor in life, and vice versa. The same relationship applies for the alternative form
of Eq. 9.7 by substituting b = B. For other forms of stress–life curve that do not form a straight line
on a log–log plot, the X N that corresponds to a given X S will vary with life.
Values around B =−0.1 are typical of stress–life curves for unnotched axial specimens
of engineering metals, as in Table 9.1. Stress–life curves from tests on notched engineering
components typically have exponents around B =−0.2 and welded structural steel members
around B =−1/3. Applying Eq. 9.12 for these values of B, we get the following safety factors
in life X N corresponding to X S = 2, and also safety factors in stress for X N = 10:
B −1/B X N for X S = 2 X S for X N = 10
−0.1 10 1024 1.26
−0.2 5 32 1.58
−0.333 3 8 2.15
We see that a quite large safety factor in life is needed to achieve even a modest safety factor in
stress, especially for shallow S-N curves where −1/B is large.
From Appendix B, Table B.4, a typical coefficient of variation for fatigue strength is δ x = 10%.
With reference to Table B.3, this implies a 0.1% failure rate, or 1 out of 1000, at a stress
3.09 × 10% = 30.9% below the mean. This in turn corresponds to a stress of 69.1% of the
mean and to a safety factor in stress of X S = 1/0.691 = 1.45. Similarly, a 0.01% failure rate,
1 out of 10,000, corresponds to 3.72 × 10% = 37.2% below the mean, implying a safety factor of
X S = 1/0.628 = 1.59. Particular cases will of course have more or less variation than the typical δ x .
Also, the foregoing logic assumes that there is no error in the S-N curve itself. Hence, these failure
rates and corresponding safety factors X S should be considered to be only a rough guide. Neverthe-
less, they do suggest that safety factors in stress for fatigue should generally be larger than 1.5.
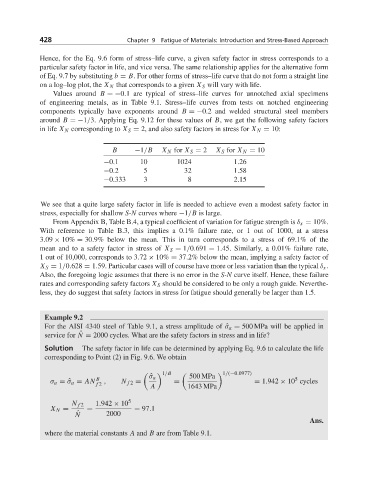
Example 9.2
For the AISI 4340 steel of Table 9.1, a stress amplitude of ˆσ a = 500 MPa will be applied in
ˆ
service for N = 2000 cycles. What are the safety factors in stress and in life?
Solution The safety factor in life can be determined by applying Eq. 9.6 to calculate the life
corresponding to Point (2) in Fig. 9.6. We obtain
1/B 1/(−0.0977)
ˆ σ a 500 MPa
5
σ a =ˆσ a = AN B , N f 2 = = = 1.942 × 10 cycles
f 2
A 1643 MPa
N f 2 1.942 × 10 5
X N = = = 97.1
N ˆ 2000
Ans.
where the material constants A and B are from Table 9.1.