
Page 426 - Mechanical Behavior of Materials
P. 426
Section 9.2 Definitions and Concepts 427
9.2.4 Safety Factors for S-N Curves
ˆ
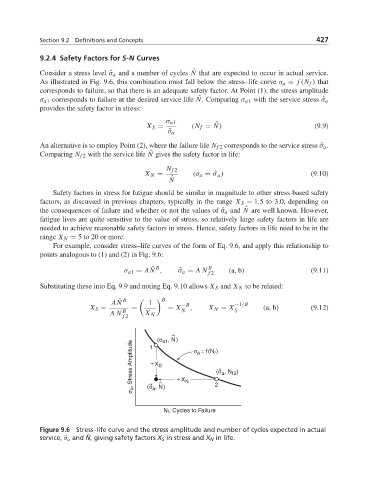
Consider a stress level ˆσ a and a number of cycles N that are expected to occur in actual service.
As illustrated in Fig. 9.6, this combination must fall below the stress–life curve σ a = f (N f ) that
corresponds to failure, so that there is an adequate safety factor. At Point (1), the stress amplitude
ˆ
σ a1 corresponds to failure at the desired service life N. Comparing σ a1 with the service stress ˆσ a
provides the safety factor in stress:
σ a1
ˆ
X S = (N f = N) (9.9)
ˆ σ a
An alternative is to employ Point (2), where the failure life N f 2 corresponds to the service stress ˆσ a .
Comparing N f 2 with the service life N gives the safety factor in life:
ˆ
N f 2
X N = (σ a =ˆσ a ) (9.10)
N ˆ
Safety factors in stress for fatigue should be similar in magnitude to other stress-based safety
factors, as discussed in previous chapters, typically in the range X S = 1.5 to 3.0, depending on
ˆ
the consequences of failure and whether or not the values of ˆσ a and N are well known. However,
fatigue lives are quite sensitive to the value of stress, so relatively large safety factors in life are
needed to achieve reasonable safety factors in stress. Hence, safety factors in life need to be in the
range X N = 5to20ormore.
For example, consider stress–life curves of the form of Eq. 9.6, and apply this relationship to
points analogous to (1) and (2) in Fig. 9.6:
B B
ˆ
σ a1 = AN , ˆ σ a = AN (a, b) (9.11)
f 2
Substituting these into Eq. 9.9 and noting Eq. 9.10 allows X S and X N to be related:
AN ˆ B 1 B −B −1/B
X S = = = X N , X N = X S (a, b) (9.12)
AN B X N
f 2
N
(σ , ) σ a = f(N )
a1
σ a , Stress Amplitude (σ a N ÷ X N 2 (σ , N )
1
f
÷
X S
f2
a
, )
N , Cycles to Failure
f
Figure 9.6 Stress–life curve and the stress amplitude and number of cycles expected in actual
service, ˆσ a and ˆ N, giving safety factors X S in stress and X N in life.