
Page 451 - Mechanical Behavior of Materials
P. 451
Section 9.7 Mean Stresses 451
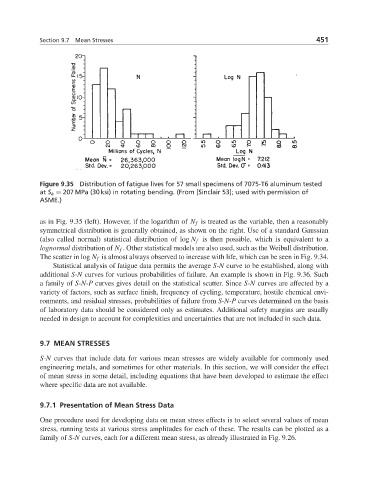
Figure 9.35 Distribution of fatigue lives for 57 small specimens of 7075-T6 aluminum tested
at S a = 207 MPa (30 ksi) in rotating bending. (From [Sinclair 53]; used with permission of
ASME.)
as in Fig. 9.35 (left). However, if the logarithm of N f is treated as the variable, then a reasonably
symmetrical distribution is generally obtained, as shown on the right. Use of a standard Gaussian
(also called normal) statistical distribution of log N f is then possible, which is equivalent to a
lognormal distribution of N f . Other statistical models are also used, such as the Weibull distribution.
Thescatterinlog N f is almost always observed to increase with life, which can be seen in Fig. 9.34.
Statistical analysis of fatigue data permits the average S-N curve to be established, along with
additional S-N curves for various probabilities of failure. An example is shown in Fig. 9.36. Such
a family of S-N-P curves gives detail on the statistical scatter. Since S-N curves are affected by a
variety of factors, such as surface finish, frequency of cycling, temperature, hostile chemical envi-
ronments, and residual stresses, probabilities of failure from S-N-P curves determined on the basis
of laboratory data should be considered only as estimates. Additional safety margins are usually
needed in design to account for complexities and uncertainties that are not included in such data.
9.7 MEAN STRESSES
S-N curves that include data for various mean stresses are widely available for commonly used
engineering metals, and sometimes for other materials. In this section, we will consider the effect
of mean stress in some detail, including equations that have been developed to estimate the effect
where specific data are not available.
9.7.1 Presentation of Mean Stress Data
One procedure used for developing data on mean stress effects is to select several values of mean
stress, running tests at various stress amplitudes for each of these. The results can be plotted as a
family of S-N curves, each for a different mean stress, as already illustrated in Fig. 9.26.