
Page 452 - Mechanical Behavior of Materials
P. 452
452 Chapter 9 Fatigue of Materials: Introduction and Stress-Based Approach
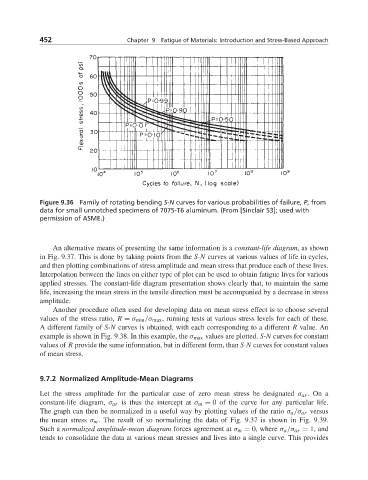
Figure 9.36 Family of rotating bending S-N curves for various probabilities of failure, P,from
data for small unnotched specimens of 7075-T6 aluminum. (From [Sinclair 53]; used with
permission of ASME.)
An alternative means of presenting the same information is a constant-life diagram,asshown
in Fig. 9.37. This is done by taking points from the S-N curves at various values of life in cycles,
and then plotting combinations of stress amplitude and mean stress that produce each of these lives.
Interpolation between the lines on either type of plot can be used to obtain fatigue lives for various
applied stresses. The constant-life diagram presentation shows clearly that, to maintain the same
life, increasing the mean stress in the tensile direction must be accompanied by a decrease in stress
amplitude.
Another procedure often used for developing data on mean stress effect is to choose several
values of the stress ratio, R = σ min /σ max , running tests at various stress levels for each of these.
A different family of S-N curves is obtained, with each corresponding to a different R value. An
example is shown in Fig. 9.38. In this example, the σ max values are plotted. S-N curves for constant
values of R provide the same information, but in different form, than S-N curves for constant values
of mean stress.
9.7.2 Normalized Amplitude-Mean Diagrams
Let the stress amplitude for the particular case of zero mean stress be designated σ ar .Ona
constant-life diagram, σ ar is thus the intercept at σ m = 0 of the curve for any particular life.
The graph can then be normalized in a useful way by plotting values of the ratio σ a /σ ar versus
the mean stress σ m . The result of so normalizing the data of Fig. 9.37 is shown in Fig. 9.39.
Such a normalized amplitude-mean diagram forces agreement at σ m = 0, where σ a /σ ar = 1, and
tends to consolidate the data at various mean stresses and lives into a single curve. This provides