
Page 454 - Mechanical Behavior of Materials
P. 454
454 Chapter 9 Fatigue of Materials: Introduction and Stress-Based Approach
σ , ksi
m
−40 −20 0 20 40 60 80 100 120
1.4
7075 - T6 Al
k = 1, axial
1.2 t
σ /σ , Normalized Stress Amplitude 0.8 σ σ ar + σ σ σ ar m + ~ m = 1
1.0
2
a
= 1
σ
u
σ
a
σ
0.6
fB
N
ar
0.4
10
a
10
10 f 4 5 6 σ a + σ m = 1
σ
0.2 7 σ ar u
10
5 x 10 8 σ σ ~ fB
u
0
−200 0 200 400 600 800
σ m , Mean Stress, MPa
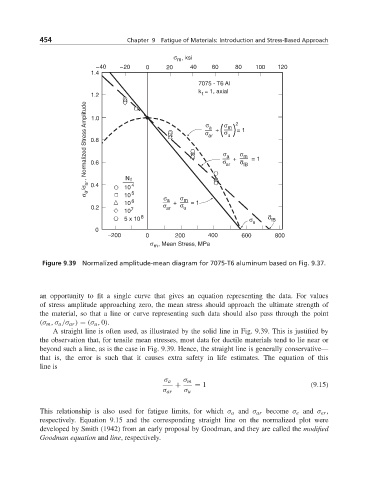
Figure 9.39 Normalized amplitude-mean diagram for 7075-T6 aluminum based on Fig. 9.37.
an opportunity to fit a single curve that gives an equation representing the data. For values
of stress amplitude approaching zero, the mean stress should approach the ultimate strength of
the material, so that a line or curve representing such data should also pass through the point
(σ m ,σ a /σ ar ) = (σ u , 0).
A straight line is often used, as illustrated by the solid line in Fig. 9.39. This is justified by
the observation that, for tensile mean stresses, most data for ductile materials tend to lie near or
beyond such a line, as is the case in Fig. 9.39. Hence, the straight line is generally conservative—
that is, the error is such that it causes extra safety in life estimates. The equation of this
line is
σ a σ m
+ = 1 (9.15)
σ ar σ u
This relationship is also used for fatigue limits, for which σ a and σ ar become σ e and σ er ,
respectively. Equation 9.15 and the corresponding straight line on the normalized plot were
developed by Smith (1942) from an early proposal by Goodman, and they are called the modified
Goodman equation and line, respectively.