
Page 453 - Mechanical Behavior of Materials
P. 453
Section 9.7 Mean Stresses 453
σ , ksi
m
-20 0 20 40 60 80 100
60
400
7075-T6 Al
k = 1, axial
t 50
4
300 N = 10 cycles 40
σ , Stress Amplitude, MPa 200 10 10 6 10 5 30 σ a
f
ksi
7
a
100 5 x 10 8 20
σ = σ 10
a ar
σ
u
0 0
0 200 400 600
σ , Mean Stress, MPa
m
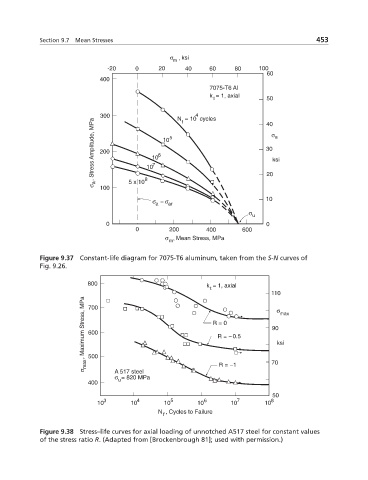
Figure 9.37 Constant-life diagram for 7075-T6 aluminum, taken from the S-N curves of
Fig. 9.26.
800 k = 1, axial
t
110
MPa 700 σ
Stress, R = 0 90 max
Maximum 600 R = −0.5 ksi
max , 500 R = −1 70
σ A 517 steel
σ = 820 MPa
u
400
50
10 3 10 4 10 5 10 6 10 7 10 8
N , Cycles to Failure
f
Figure 9.38 Stress–life curves for axial loading of unnotched A517 steel for constant values
of the stress ratio R. (Adapted from [Brockenbrough 81]; used with permission.)