
Page 449 - Mechanical Behavior of Materials
P. 449
Section 9.6 Trends in S-N Curves 449
2000 Crack initiation
σ a , Stress Amplitude, MPa 1600 σ = 1298 MPa Internal
1800
Surface
1400
1200
e
1000
800 SUJ2 Steel
10 3 10 4 10 5 10 6 10 7 10 8 10 9 10 10
N , Cycles to Failure
f
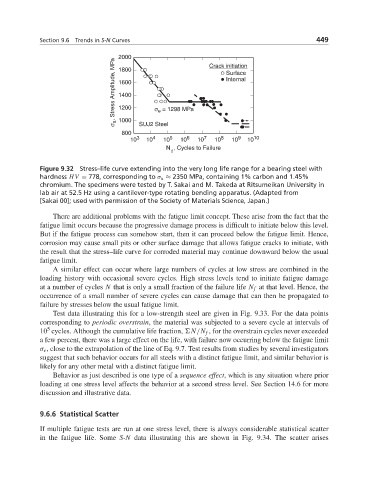
Figure 9.32 Stress–life curve extending into the very long life range for a bearing steel with
hardness HV = 778, corresponding to σ u ≈ 2350 MPa, containing 1% carbon and 1.45%
chromium. The specimens were tested by T. Sakai and M. Takeda at Ritsumeikan University in
lab air at 52.5 Hz using a cantilever-type rotating bending apparatus. (Adapted from
[Sakai 00]; used with permission of the Society of Materials Science, Japan.)
There are additional problems with the fatigue limit concept. These arise from the fact that the
fatigue limit occurs because the progressive damage process is difficult to initiate below this level.
But if the fatigue process can somehow start, then it can proceed below the fatigue limit. Hence,
corrosion may cause small pits or other surface damage that allows fatigue cracks to initiate, with
the result that the stress–life curve for corroded material may continue downward below the usual
fatigue limit.
A similar effect can occur where large numbers of cycles at low stress are combined in the
loading history with occasional severe cycles. High stress levels tend to initiate fatigue damage
at a number of cycles N that is only a small fraction of the failure life N f at that level. Hence, the
occurrence of a small number of severe cycles can cause damage that can then be propagated to
failure by stresses below the usual fatigue limit.
Test data illustrating this for a low-strength steel are given in Fig. 9.33. For the data points
corresponding to periodic overstrain, the material was subjected to a severe cycle at intervals of
5
10 cycles. Although the cumulative life fraction, N/N f , for the overstrain cycles never exceeded
a few percent, there was a large effect on the life, with failure now occurring below the fatigue limit
σ e , close to the extrapolation of the line of Eq. 9.7. Test results from studies by several investigators
suggest that such behavior occurs for all steels with a distinct fatigue limit, and similar behavior is
likely for any other metal with a distinct fatigue limit.
Behavior as just described is one type of a sequence effect, which is any situation where prior
loading at one stress level affects the behavior at a second stress level. See Section 14.6 for more
discussion and illustrative data.
9.6.6 Statistical Scatter
If multiple fatigue tests are run at one stress level, there is always considerable statistical scatter
in the fatigue life. Some S-N data illustrating this are shown in Fig. 9.34. The scatter arises