Page 193 - Introduction to Statistical Pattern Recognition
P. 193

4  Parametric Classifiers                                    175
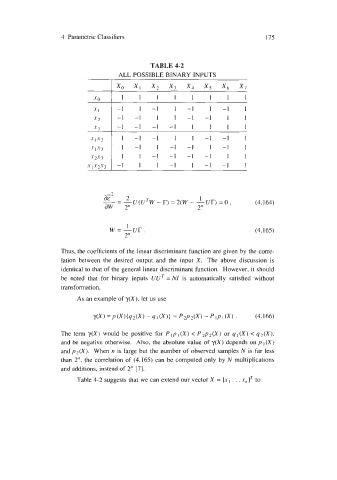


                                               TABLE 4-2
                                     ALL POSSIBLE BINARY INPUTS


                             .UOI1         1    1     1    1    1     1    1
                             s       -1    1   -1     1   -1    1   -1     1
                               I
                             x2      -1   -1    1     1   -1   -1     I    1
                                     -1   -1   -1   -1     1    1     1    1
                             -r 3
                                      1   -1   -1     1    1   -1   -1     1
                                      1   -1    1   -1    -1    1   -1     1
                                      1    1   -1   -1    -1   -1     1    1
                                     -1    1    1   -1     1   -1   -1     1


                                 aE2
                                       2
                                                              1
                                -- - -u(uTw - r) = 2(w - -ur)  = 0,           (4.164)
                                 aw    2"                    2"
                                        1
                                  w=-ur.                                      (4.165)
                                       2"

                    Thus, the coefficients of the linear discriminant function are given by the corre-
                    lation  between  the  desired  output  and  the  input  X.  The  above  discussion  is
                    identical to that of the general linear discriminant function.  However, it should
                    be  noted  that  for  binary  inputs  UUT = NI  is  automatically  satisfied  without
                    transformation.
                         As an example of y(X), let us use


                    The  term  y(X)  would  be  positive  for  P ,p I (X) < P *p2(X) or q I (X) < q 2(X),
                    and be  negative otherwise.  Also, the absolute value of  y(X) depends on p  I  (X)
                    and p2(X).  When n  is large but the number of  observed samples N  is far less
                    than  2", the correlation of  (4.165) can be  computed only by  N  multiplications
                    and additions, instead of 2"  [7].
                         Table 4-2 suggests that we can extend our vector X = [xI . . . xnIT to
   188   189   190   191   192   193   194   195   196   197   198