
Page 24 - Introduction to Statistical Pattern Recognition
P. 24
6 Introduction to Statistical Pattern Recognition
class 1
+
+ +
+ class 2
+
0
0
+
+ 0
0 0
I 0 0
I + XI
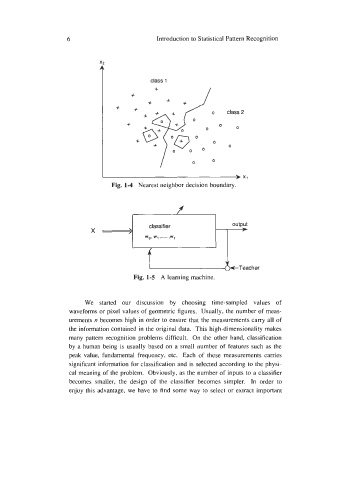
Fig. 1-4 Nearest neighbor decision boundary.
f
*
X > classifier output
wo, w 1,"" '., wy
We started our discussion by choosing time-sampled values of
waveforms or pixel values of geometric figures. Usually, the number of meas-
urements n becomes high in order to ensure that the measurements carry all of
the information contained in the original data. This high-dimensionality makes
many pattern recognition problems difficult. On the other hand, classification
by a human being is usually based on a small number of features such as the
peak value, fundamental frequency, etc. Each of these measurements carries
significant information for classification and is selected according to the physi-
cal meaning of the problem. Obviously, as the number of inputs to a classifier
becomes smaller, the design of the classifier becomes simpler. In order to
enjoy this advantage, we have to find some way to select or extract important