
Page 330 - Introduction to Statistical Pattern Recognition
P. 330
312 Introduction to Statistical Pattern Recognition
errors counted in Table 7-l(b) is identical to that obtained from the voting 2NN
procedure using the 2nd-NN and 3rd-NN columns. In the voting 2NN pro-
cedure, a sample is rejected if the classes of the 2nd-NN and 3rd-NN columns
disagree (see X2), and the case is not considered an error. Adding the 1st-NN
column, this reject case (X2) becomes correct, but the error case (X,) still
remains an error. Thus, the L method version of the voting 2NN procedure is
the same as the R method version of the voting 3NN procedure.
An experiment was conducted to compare the performances of two
approaches: one is to divide the available sample set into design and test (the H
method), and the other uses the procedure of Table 7- 1 (a) (the L method).
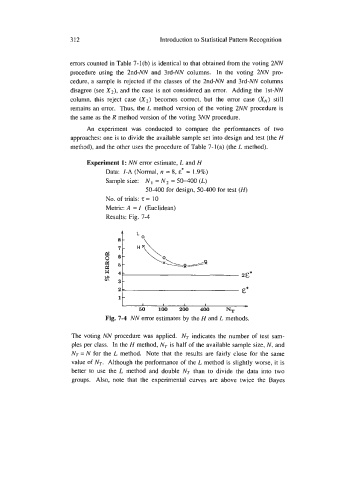
Experiment 1: NN error estimate, L and H
Data: I-A (Normal, n = 8, E* = 1.9%)
Sample size: N, = N2 = 50-400 (L)
50-400 for design, 50-400 for test (H)
No. of trials: z = 10
Metric: A = I (Euclidean)
Results: Fig. 7-4
2- E*
1- -
I I I I
The voting NN procedure was applied. Nr indicates the number of test sam-
ples per class. In the H method, NT is half of the available sample size, N, and
NT = N for the L method. Note that the results are fairly close for the same
value of NT. Although the performance of the L method is slightly worse, it is
better to use the L method and double Nr than to divide the data into two
groups. Also, note that the experimental curves are above twice the Bayes