
Page 370 - Introduction to Statistical Pattern Recognition
P. 370
352 Introduction to Statistical Pattern Recognition
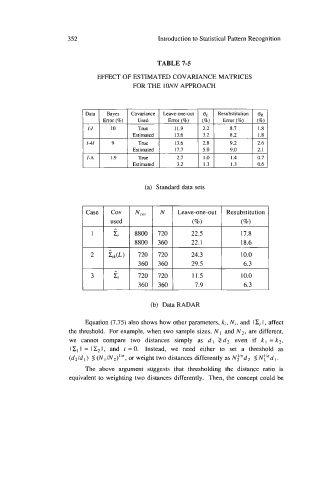
TABLE 7-5
EFFECT OF ESTIMATED COVARIANCE MATRICES
FOR THE lONN APPROACH
Data Bayes Covariance Leave-one-out a~ Resubstitution oR
Error (%) Used Error(%) (%) Error(%) (%)
I-I IO True 11.9 2.2 8.7 1.8
Estimated 13.6 3.2 8.2 I .8
1-4 9 True 13.6 2.8 9.2 2.6
Estimated 17.7 5.0 9.0 2. I
I-A 1.9 True 2.7 I .o 1.4 0.7
Estimated 3.2 I .3 I .3 0.6
(a) Standard data sets
Case Cov N,,,. N Leave-one-out Resubstitution
used (%) (%)
1 !& 8800 720 22.5 17.8
8800 360 22.1 18.6
2 &(L) 720 720 24.3 10.0
360 360 29.5 6.3
3 i; 720 720 11.5 10.0
360 360 7.9 6.3
(b) Data RADAR
Equation (7.75) also shows how other parameters, k;, N;, and I C; I, affect
the threshold. For example, when two sample sizes, N I and N2, are different,
we cannot compare two distances simply as dl ><d2 even if kl = k2,
ICI I = I C2 I, and t = 0. Instead, we need either to set a threshold as
or
(d2Idl) 5 (N IIN2)1/n, weight two distances differently as N4'"d2 5 Nl/"dl.
The above argument suggests that thresholding the distance ratio is
equivalent to weighting two distances differently. Then, the concept could be