
Page 372 - Introduction to Statistical Pattern Recognition
P. 372
354 Introduction to Statistical Pattern Recognition
0 5 10 15 20
X
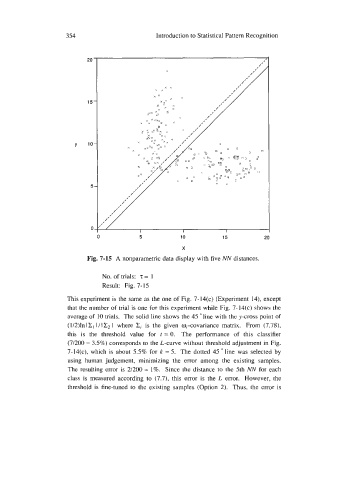
Fig. 7-15 A nonparametric data display with five NN distances.
No. of trials: z = 1
Result: Fig. 7-15
This experiment is the same as the one of Fig. 7-14(c) (Experiment 14), except
that the number of trial is one for this experiment while Fig. 7-14(c) shows the
average of 10 trials. The solid line shows the 45 "line with the y-cross point of
(1/2)ln I C, I / I C2 I where Zj is the given oj-covariance matrix. From (7.78),
this is the threshold value for t = 0. The performance of this classifier
(71200 = 3.5%) corresponds to the L-curve without threshold adjustment in Fig.
7-14(c), which is about 5.5% for k = 5. The dotted 45 line was selected by
using human judgement, minimizing the error among the existing samples.
The resulting error is 2/200 = 1%. Since the distance to the 5th NN for each
class is measured according to (7.7), this error is the L error. However, the
threshold is fine-tuned to the existing samples (Option 2). Thus, the error is