
Page 91 - Introduction to Statistical Pattern Recognition
P. 91
3 Hypothesis Testing 73
-n
0.1 I I I I111111 , I IIIIIII I I I111111 I , IIIIII
8 16 32 64 128 256
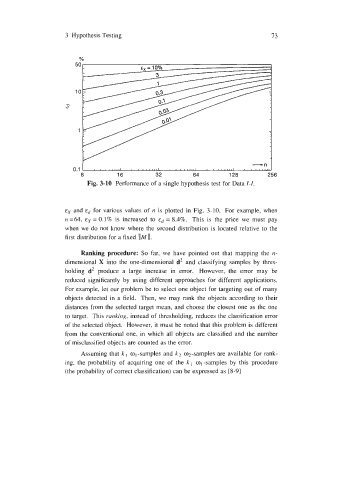
Fig. 3-10 Performance of a single hypothesis test for Data 1-1.
ex and ed for various values of n is plotted in Fig. 3-10. For example, when
n =64, &X = 0.1% is increased to &d = 8.4%. This is the price we must pay
when we do not know where the second distribution is located relative to the
first distribution for a fixed IlM 11.
Ranking procedure: So far, we have pointed out that mapping the n-
dimensional X into the one-dimensional d2 and classifying samples by thres-
holding d2 produce a large increase in error. However, the error may be
reduced significantly by using different approaches for different applications.
For example, let our problem be to select one object for targeting out of many
objects detected in a field. Then, we may rank the objects according to their
distances from the selected target mean, and choose the closest one as the one
to target. This ranking, instead of thresholding, reduces the classification error
of the selected object. However, it must be noted that this problem is different
from the conventional one, in which all objects are classified and the number
of misclassified objects are counted as the error.
Assuming that kl ol-samples and k2 02-samples are available for rank-
ing, the probability of acquiring one of the k, ol-samples by this procedure
(the probability of correct classification) can be expressed as [8-91