
Page 95 - Introduction to Statistical Pattern Recognition
P. 95
3 Hypothesis Testing 77
Note in (3.79) that the a's of the numerator are cancelled out with the a's of
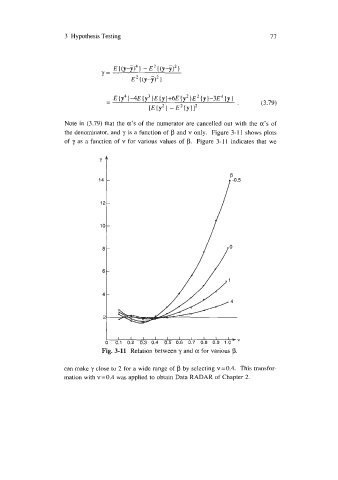
the denominator, and y is a function of p and v only. Figure 3-1 1 shows plots
of y as a function of v for various values of p. Figure 3-11 indicates that we
b 011 012 013 0:4 015 0:s 017 018 of9 1.b-
Fig. 3-11 Relation between y and a for various p.
can make y close to 2 for a wide range of p by selecting v = 0.4. This transfor-
mation with v=O.4 was applied to obtain Data RADAR of Chapter 2.