
Page 98 - Introduction to Statistical Pattern Recognition
P. 98
80 Introduction to Statistical Pattern Recognition
n=5,20. 100: k-50
t\ If n-5, 20, 100: k-10
.075 ////-- I
n=5, 20, 100: kz50
n=5,20,100: k=10
.025
0
0 .2 .4 .6 .a 1 .o
Reject Probability a
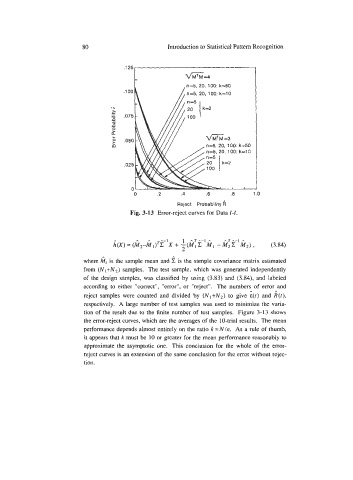
Fig. 3-13 Error-reject curves for Data 1-1.
where Gi is the sample mean and 5 is the sample covariance matrix estimated
from (Nl+N2) samples. The test sample, which was generated independently
of the design samples, was classified by using (3.83) and (3.84), and labeled
according to either "correct", "error", or "reject". The numbers of error and
reject samples were counted and divided by (N1+N2) to give &> and i(t>,
respectively. A large number of test samples was used to minimize the varia-
tion of the result due to the finite number of test samples. Figure 3-13 shows
the error-reject curves, which are the averages of the 10-trial results. The mean
performance depends almost entirely on the ratio k = N/n. As a rule of thumb,
it appears that k must be 10 or greater for the mean performance reasonably to
approximate the asymptotic one. This conclusion for the whole of the error-
reject curves is an extension of the same conclusion for the error without rejec-
tion.