
Page 97 - Introduction to Statistical Pattern Recognition
P. 97
3 Hypothesis Testing 79
I I
+ *x
L, (t)
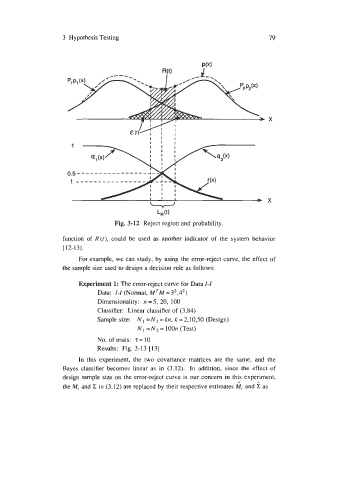
Fig. 3-12 Reject region and probability.
function of R(t), could be used as another indicator of the system behavior
[ 12- 131.
For example, we can study, by using the error-reject curve, the effect of
the sample size used to design a decision rule as follows:
Experiment 1: The error-reject curve for Data I-I
Data: I-I (Normal, MTM =32,42)
Dimensionality: n =5, 20, 100
Classifier: Linear classifier of (3.84)
Sample size: N =N2 =kn, k = 2,10,50 (Design)
I
NI =N2=100n (Test)
No. of trials: T= 10
Results: Fig. 3-13 1131
In this experiment, the two covariance matrices are the same, and the
Bayes classifier becomes linear as in (3.12). In addition, since the effect of
design sample size on the error-reject curve is our concern in this experiment,
the M, and C in (3.12) are replaced by their respective estimates hi and 2 as