
Page 99 - Introduction to Statistical Pattern Recognition
P. 99
3 Hypothesis Testing 81
Experiment 2: The error-reject curve for Data I-A
Data: Case I - I-A (Normal, n = 8)
Case I1 - I-A except M I = M 2
Classifier: Quadratic classifier of (3.1 1) with GI, ii
Sample size: N I = N = kn, k = 2,4,8,50 (Design)
NI =N2 = lOOn =go0 (Test)
No. of trials: z= 10
Results: Fig. 3-14 [13]
'25P
Case I (data I-A)
/Jk=50
.2 .4 .6 .8 1 .o
Reject Probability h
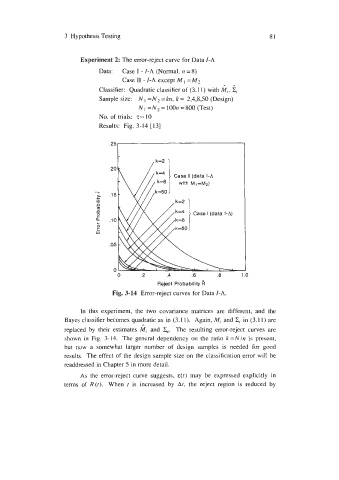
Fig. 3-14 Error-reject curves for Data I-A.
In this experiment, the two covariance matrices are different, and the
Bayes classifier becomes quadratic as in (3.11). Again, MI and X, in (3.1 1) are
L.
replaced by their estimates Mi and &.. The resuIting error-reject curves are
shown in Fig. 3-14. The general dependency on the ratio k=Nh is present,
but now a somewhat larger number of design samples is needed for good
results. The effect of the design sample size on the classification error will be
readdressed in Chapter 5 in more detail.
As the error-reject curve suggests, ~(t) may be expressed explicitly in
terms of R(r). When r is increased by Ar, the reject region is reduced by