
Page 122 - Materials Chemistry, Second Edition
P. 122
106 3 Life Cycle Inventory Analysis
figures of the bottles decrease by 1/TR, for example, assuming an effective mass
of 800 g (bottle weight) to 20 g per filling for a TR of 40! This is, of course, not true
for expenditures that are incurred for each filling:
• Cleaning,
• Transport,
• Label and
• Closure.
In good multi-use systems or those with high TR, these factors have a much higher
relative environmental impact. An optimum multi-use system is characterised by:
• standardised, stable containers,
• sale in crates,
• deposit system,
• decentralised supply, short transport distances and
• minimum environmental impact by the filling process, closure, label, and so on.
The first three measures aim at an increase of the TR, the latter two at a decrease
of the impacts of the remaining processes. LCAs have contributed a lot to an
understanding of these production systems and processes. 100) An often vigorous
discussion on single versus multi-use packaging is thus not focussed on general
principles but aims at the generalisation of results that were obtained for individual
systems. For comparison, the system boundaries of the compared product systems
and the data quality must be strictly examined.
The use of collected one-way containers in a new production after melting is
also a part of CLR. Other examples of CLR include production scraps, for example,
thermoplasts, glass and metals, which by melting can frequently be funnelled back
into the production process (e.g. extrusion).
The treatment of CLR in LCI can be summarised as follows: in case of sufficient
data no assumptions have to made, the processes can be derived by scientific-
technical means. An allocation problem does not occur, because all processes take
place within the system boundary. This is also the result of a formal deduction
which has been briefly appreciated in Section 3.3.1. 101)
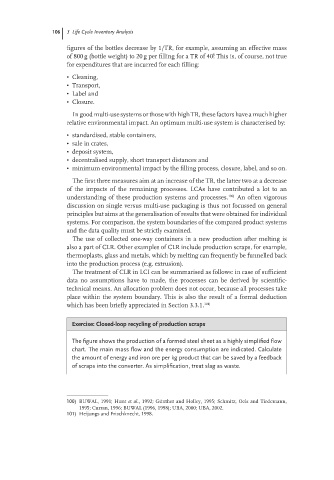
Exercise: Closed-loop recycling of production scraps
The figure shows the production of a formed steel sheet as a highly simplified flow
chart. The main mass flow and the energy consumption are indicated. Calculate
the amount of energy and iron ore per kg product that can be saved by a feedback
of scraps into the converter. As simplification, treat slag as waste.
100) BUWAL, 1991; Hunt et al., 1992; G¨ unther and Holley, 1995; Schmitz, Oels and Tiedemann,
1995; Curran, 1996; BUWAL (1996, 1998); UBA, 2000; UBA, 2002.
101) Heijungs and Frischknecht, 1998.