
Page 243 - Petroleum Production Engineering, A Computer-Assisted Approach
P. 243
Guo, Boyun / Computer Assited Petroleum Production Engg 0750682701_chap15 Final Proof page 241 22.12.2006 6:14pm
WELL PROBLEM IDENTIFICATION 15/241
Summary
Table 15.1 Basic Parameter Values for Example
Problem 15.1 This chapter presents a guideline to identifying problems
commonly encountered in oil and gas wells. Well test
Gas-specific gravity 0:7 (air ¼ 1) analysis provides a means of estimating properties of indi-
Hole inclination 0 degrees vidual pay zones. Production logging analysis identifies
Wellhead temperature 608 fluid entries to the wellbore from different zones. The
Geothermal gradient 0.01 8F/ft Guo et al. method is more accurate than the Turner et al.
Condensate gravity 60 8API method for predicting liquid-loading problems in gas pro-
Water-specific gravity 1:05 (water ¼ 1) duction wells.
Solid-specific gravity 2:65 (water ¼ 1)
Interfacial tension 20 dyne/cm
Tubing wall roughness 0.000015 in. References
chaudhry, a.c. Oil Well Testing Handbook. Burlington:
Table 15.2 Result Given by the Spreadsheet Program Gulf Professional Publishing, 2004.
GasWellLoading.xls clark, n.j. and schultz, w.p. The analysis of problem
wells. Petroleum Engineer September 1956;28:B30–
Calculated Parameters B38.
Hydraulic diameter 0.2034 ft coleman, s.b., clay, h.b., mccurdy, d.g., and norris,
Conduit cross-sectional area 0.0325 ft 2
Average temperature 570 8R l.h., iii. A new look at predicting gas well loading-up.
Minimum kinetic energy 1.6019 lb-ft/ft 3 JPT (March 1991), Trans. AIME 1991;291:329.
a ¼ 2.77547E-05 dake, l.p. Fundamentals of Reservoir Engineering.
b ¼ 1.20965E-07 Amsterdam: Elsevier, 2002.
c ¼ 875999.8117 dobkins, t.a. Improved method to determine hydraulic
d ¼ 0.10598146 fracture height. JPT April 1981:719–726.
e ¼ 0.000571676 economides, m.j., hill, a.d., and ehlig-economides, c.
f M ¼ 0.007481992 Petroleum Production Systems. New Jersey: Prentice
m ¼ 53.07387106 Hall PTR, 1994.
n ¼ 438684299.6
E-Production Services, Inc. FloSystem User Manual.
Edinburgh: E-Production Services, Inc., 2005.
Solution
Critical gas production rate 1,059 Mscf/day E-Production Services, Inc. PanSystem User Manual.
Pressure ( p) ¼ 1,189 psia Edinburgh: E-Production Services, Inc., 2004.
Objective function f(Q gm ) ¼ 1:78615E-05 fekete., f.a.s.t. WellTest User Manual. Calgary: Fekete
Associates, Inc., 2003.
guo, b., ghalambor, a., and xu, c. A systematic approach
to predicting liquid loading in gas well. SPE Produc-
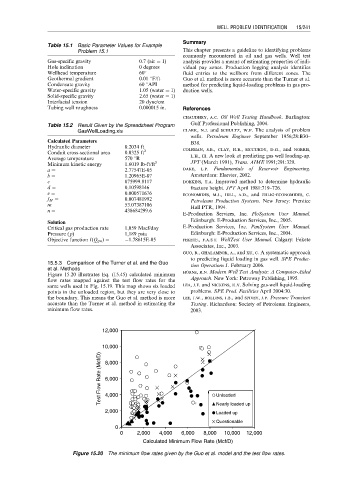
15.5.3 Comparison of the Turner et al. and the Guo tion Operations J. February 2006.
et al. Methods
Figure 15.20 illustrates Eq. (15.45)–calculated minimum horne, r.n. Modern Well Test Analysis: A Computer-Aided
flow rates mapped against the test flow rates for the Approach. New York: Petroway Publishing, 1995.
same wells used in Fig. 15.19. This map shows six loaded lea, j.f. and nickens, h.v. Solving gas-well liquid-loading
points in the unloaded region, but they are very close to problems. SPE Prod. Facilities April 2004:30.
the boundary. This means the Guo et al. method is more lee, j.w., rollins, j.b., and spivey, j.p. Pressure Transient
accurate than the Turner et al. method in estimating the Testing. Richardson: Society of Petroleum Engineers,
minimum flow rates. 2003.
12,000
10,000
Test Flow Rate (Mcf/D) 6,000 Unloaded
8,000
4,000
2,000 ? Nearly loaded up
Loaded up
Questionable
0
0 2,000 4,000 6,000 8,000 10,000 12,000
Calculated Minimum Flow Rate (Mcf/D)
Figure 15.20 The minimum flow rates given by the Guo et al. model and the test flow rates.