
Page 240 - Petroleum Production Engineering, A Computer-Assisted Approach
P. 240
Guo, Boyun / Computer Assited Petroleum Production Engg 0750682701_chap15 Final Proof page 238 22.12.2006 6:14pm
15/238 PRODUCTION ENHANCEMENT
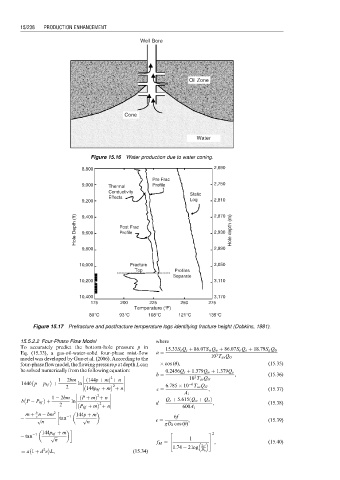
Well Bore
Oil Zone
Cone
Water
Figure 15.16 Water production due to water coning.
8,800 2,690
Pre Frac
9,000 Profile 2,750
Thermal
Conductivity
Static
Effects
9,200 Log 2,810
Hole Depth (ft) 9,400 Post Frac 2,870 Hole depth (m)
2,930
Profile
9,600
9,800 2,990
10,000 Fracture 3,050
Top Profiles
Separate
10,200 3,110
10,400 3,170
175 200 225 250 275
Temperature ( F)
80 C 93 C 108 C 121 C 135 C
Figure 15.17 Prefracture and postfracture temperature logs identifying fracture height (Dobkins, 1981).
15.5.2.2 Four-Phase Flow Model where
To accurately predict the bottom-hole pressure p in
15:33S s Q s þ 86:07S w Q w þ 86:07S o Q o þ 18:79S g Q G
Eq. (15.33), a gas-oil-water-solid four-phase mist-flow a ¼ 3
model was developed by Guo et al. (2006). According to the 10 T av Q G
four-phaseflowmodel,theflowingpressurepatdepthL can cos (u), (15:35)
be solved numerically from the following equation: 0:2456Q s þ 1:379Q w þ 1:379Q o
b ¼ , (15:36)
3
2
1 2bm ð 144p þ mÞ þ n 10 T av Q G
144bp p hf þ ln 2 6
2 144p hf þ m þ n c ¼ 6:785 10 T av Q G , (15:37)
A i
2
1 2bm ð P þ mÞ þ n
ð
bP P hf þ ln d ¼ Q s þ 5:615 Q w þ Q o Þ , (15:38)
2
2 P hf þ m þ n
600A i
b
m þ n bm 2 144p þ m
c p ffiffiffi tan 1 p ffiffiffi 6f
n n e ¼ , (15:39)
gD h cos (u)
2
ffiffiffi
p
tan 1 144p hf þ m 3 2
n f M ¼ 4 1 5 , (15:40)
1:74 2 log 2" 0
2
¼ a 1 þ d e L, (15:34) D h