
Page 268 - Petroleum Production Engineering, A Computer-Assisted Approach
P. 268
Guo, Boyun / Computer Assited Petroleum Production Engg 0750682701_chap18 Final Proof page 268 4.1.2007 10:04pm Compositor Name: SJoearun
18/268 PRODUCTION ENHANCEMENT
18.1 Introduction
The term ‘‘production optimization’’ has been used to
describe different processes in the oil and gas industry.
A rigorous definition of the term has not been found
from the literature. The book by Beggs (2003) ‘‘Production After Stimulation
Optimization Using NODAL Analysis’’ presents a systems
analysis approach (called NODAL analysis, or Nodal
analysis) to analyze performance of production systems. Bottom Hole Pressure(p wf )
Although the entire production system is analyzed as a
total unit, interacting components, electrical circuits,
complex pipeline networks, pumps, and compressors are Before Stimulation
evaluated individually using this method. Locations of
excessive flow resistance or pressure drop in any part of
the network are identified.
To the best of our understanding, production optimiza-
tion means determination and implementation of the Production Rate(q)
optimum values of parameters in the production system
to maximize hydrocarbon production rate (or discounted Figure 18.1 Comparison of oil well inflow performance
revenue) or to minimize operating cost under various tech- relationship (IPR) curves before and after stimulation.
nical and economical constraints. Because a system can be
defined differently, the production optimization can be
performed at different levels such as well level, platform/ whether the well inflow is the limiting step that controls
facility level, and field level. This chapter describes well deliverability. If yes, treatment design may proceed
production optimization of systems defined as (Chapters 16 and 17) and economic evaluation should be
performed (see Section 18.9). If no, optimization of tubing
. Naturally flowing well size should be investigated.
. Gas-lifted well It is not true that the larger the tubing size is, the higher
. Sucker rod–pumped well the well deliverability is. This is because large tubing
. Separator reduces the gas-lift effect in oil wells. Large tubing also
. Pipeline network results in liquid loading of gas wells due to the inadequate
. Gas lift facility kinetic energy of gas flow required to lift liquid. The
. Oil and gas production fields
optimal tubing size yields the lowest frictional pressure
In the upstream oil and gas production, various appro- drop and the maximum production rate. Nodal analysis
aches and technologies are used to address different as- can be used to generate tubing performance curve (plot of
pects of hydrocarbon production optimization. They serve operating rate vs tubing size) from which the optimum
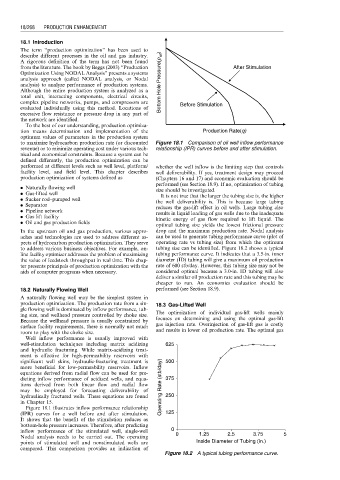
to address various business objectives. For example, on- tubing size can be identified. Figure 18.2 shows a typical
line facility optimizer addresses the problem of maximizing tubing performance curve. It indicates that a 3.5-in. inner
the value of feedstock throughput in real time. This chap- diameter (ID) tubing will give a maximum oil production
ter presents principals of production optimization with the rate of 600 stb/day. However, this tubing size may not be
aids of computer programs when necessary. considered optimal because a 3.0-in. ID tubing will also
deliver a similar oil production rate and this tubing may be
cheaper to run. An economics evaluation should be
18.2 Naturally Flowing Well performed (see Section 18.9).
A naturally flowing well may be the simplest system in
production optimization. The production rate from a sin- 18.3 Gas-Lifted Well
gle flowing well is dominated by inflow performance, tub-
ing size, and wellhead pressure controlled by choke size. The optimization of individual gas-lift wells mainly
Because the wellhead pressure is usually constrained by focuses on determining and using the optimal gas-lift
surface facility requirements, there is normally not much gas injection rate. Overinjection of gas-lift gas is costly
room to play with the choke size. and results in lower oil production rate. The optimal gas
Well inflow performance is usually improved with
well-stimulation techniques including matrix acidizing 625
and hydraulic fracturing. While matrix-acidizing treat-
ment is effective for high-permeability reservoirs with
significant well skins, hydraulic-fracturing treatment is 500
more beneficial for low-permeability reservoirs. Inflow
equations derived from radial flow can be used for pre-
dicting inflow performance of acidized wells, and equa- 375
tions derived from both linear flow and radial flow
may be employed for forecasting deliverability of Operating Rate (stb/day)
hydraulically fractured wells. These equations are found 250
in Chapter 15.
Figure 18.1 illustrates inflow performance relationship
(IPR) curves for a well before and after stimulation. 125
It shows that the benefit of the stimulation reduces as
bottom-hole pressure increases. Therefore, after predicting
inflow performance of the stimulated well, single-well 0
Nodal analysis needs to be carried out. The operating 0 1.25 2.5 3.75 5
points of stimulated well and nonstimulated wells are Inside Diameter of Tubing (in.)
compared. This comparison provides an indication of
Figure 18.2 A typical tubing performance curve.