
Page 270 - Petroleum Production Engineering, A Computer-Assisted Approach
P. 270
Guo, Boyun / Computer Assited Petroleum Production Engg 0750682701_chap18 Final Proof page 270 4.1.2007 10:04pm Compositor Name: SJoearun
18/270 PRODUCTION ENHANCEMENT
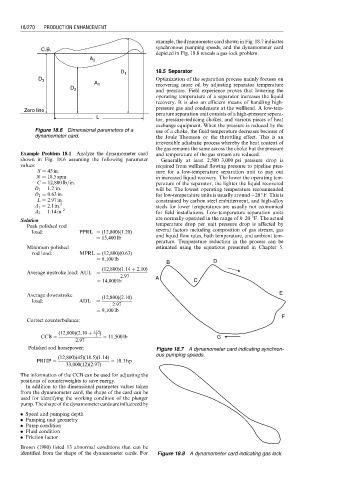
example, the dynamometer card shown in Fig. 18.7 indicates
synchronous pumping speeds, and the dynamometer card
C.B.
depicted in Fig. 18.8 reveals a gas-lock problem.
A 2
18.5 Separator
D 1
D 3 Optimization of the separation process mainly focuses on
recovering more oil by adjusting separator temperature
A 1
D 2
and pressure. Field experience proves that lowering the
operating temperature of a separator increases the liquid
recovery. It is also an efficient means of handling high-
pressure gas and condensate at the wellhead. A low-tem-
Zero line
perature separation unit consists of a high-pressure separa-
L
tor, pressure-reducing chokes, and various pieces of heat
exchange equipment. When the pressure is reduced by the
Figure 18.6 Dimensional parameters of a use of a choke, the fluid temperature decreases because of
dynamometer card. the Joule–Thomson or the throttling effect. This is an
irreversible adiabatic process whereby the heat content of
the gas remains the same across the choke but the pressure
Example Problem 18.1 Analyze the dynamometer card and temperature of the gas stream are reduced.
shown in Fig. 18.6 assuming the following parameter Generally at least 2,500–3,000 psi pressure drop is
values: required from wellhead flowing pressure to pipeline pres-
S ¼ 45 in: sure for a low-temperature separation unit to pay out
N ¼ 18:5 spm in increased liquid recovery. The lower the operating tem-
C ¼ 12,800 lb=in: perature of the separator, the lighter the liquid recovered
D 1 ¼ 1:2in: will be. The lowest operating temperature recommended
D 2 ¼ 0:63 in: for low-temperature units is usually around 20 F. This is
L ¼ 2:97 in: constrained by carbon steel embitterment, and high-alloy
A 1 ¼ 2:1in: 2 steels for lower temperatures are usually not economical
A 2 ¼ 1:14 in: 2 for field installations. Low-temperature separation units
are normally operated in the range of 0–20 8F. The actual
Solution
Peak polished rod temperature drop per unit pressure drop is affected by
load: PPRL ¼ (12,800)(1:20) several factors including composition of gas stream, gas
¼ 15,400 lb and liquid flow rates, bath temperature, and ambient tem-
perature. Temperature reduction in the process can be
Minimum polished estimated using the equations presented in Chapter 5.
rod load: MPRL ¼ (12,800)(0:63)
¼ 8,100 lb
B D
(12,800)(1:14 þ 2:10)
Average upstroke load: AUL ¼
2:97 A
¼ 14,000 lb C
Average downstroke (12,800)(2:10) E
load: ADL ¼
2:97
¼ 9,100 lb
F
Correct counterbalance:
(12,800)(2:10 þ 1:14 )
CCB ¼ 2 ¼ 11,500 lb G
2:97
Polished rod horsepower: Figure 18.7 A dynamometer card indicating synchron-
ous pumping speeds.
(12,800)(45)(18:5)(1:14)
PRHP ¼ ¼ 10:3hp
33,000(12)(2:97)
The information of the CCB can be used for adjusting the
positions of counterweights to save energy.
In addition to the dimensional parameter values taken
from the dynamometer card, the shape of the card can be
used for identifying the working condition of the plunger
pump. The shapeofthedynamometercardsare influencedby
. Speed and pumping depth
. Pumping unit geometry
. Pump condition
. Fluid condition
. Friction factor
Brown (1980) listed 13 abnormal conditions that can be
identified from the shape of the dynamometer cards. For Figure 18.8 A dynamometer card indicating gas lock.