
Page 413 -
P. 413
13.10 CHAPTER THIRTEEN
NDP = Ptm - 7rtm
where NDP = net driving pressure, psi
Ptm = transmembrane (hydraulic) pressure differential, psi
7rtm = transmembrane osmotic pressure differential, psi
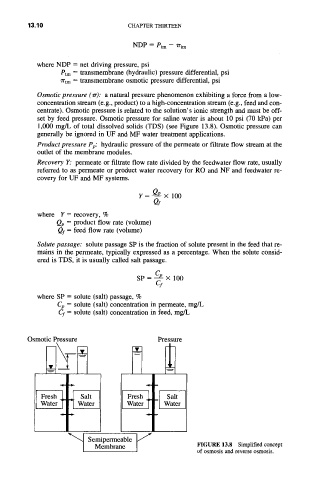
Osmotic pressure (or): a natural pressure phenomenon exhibiting a force from a low-
concentration stream (e.g., product) to a high-concentration stream (e.g., feed and con-
centrate). Osmotic pressure is related to the solution's ionic strength and must be off-
set by feed pressure. Osmotic pressure for saline water is about 10 psi (70 kPa) per
1,000 mg/L of total dissolved solids (TDS) (see Figure 13.8). Osmotic pressure can
generally be ignored in UF and MF water treatment applications.
Product pressure Pp: hydraulic pressure of the permeate or filtrate flow stream at the
outlet of the membrane modules.
Recovery Y: permeate or filtrate flow rate divided by the feedwater flow rate, usually
referred to as permeate or product water recovery for RO and NF and feedwater re-
covery for UF and MF systems.
Y= Q-Q-e-x 100
Of
where Y = recovery, %
Qp = product flow rate (volume)
Qf = feed flow rate (volume)
Solute passage: solute passage SP is the fraction of solute present in the feed that re-
mains in the permeate, typically expressed as a percentage. When the solute consid-
ered is TDS, it is usually called salt passage.
SP= C---e-× 100
c:
where SP = solute (salt) passage, %
Cp = solute (salt) concentration in permeate, mg/L
Cf = solute (salt) concentration in feed, mg/L
Osmotic Pressure Pressure
Salt Fresh ~ I Salt I
Water I Water I
S e~ipem~r eanable K
FIGURE 13.8 Simplified concept
of osmosis and reverse osmosis.