
Page 165 - A Comprehensive Guide to Solar Energy Systems
P. 165
166 A CoMPrehensIVe GuIde To soLAr enerGy sysTeMs
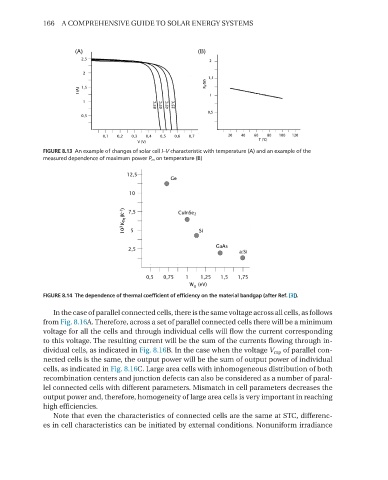
FIGURE 8.13 An example of changes of solar cell I–V characteristic with temperature (A) and an example of the
measured dependence of maximum power P m on temperature (B)
FIGURE 8.14 The dependence of thermal coefficient of efficiency on the material bandgap (after Ref. [3]).
In the case of parallel connected cells, there is the same voltage across all cells, as follows
from Fig. 8.16A. Therefore, across a set of parallel connected cells there will be a minimum
voltage for all the cells and through individual cells will flow the current corresponding
to this voltage. The resulting current will be the sum of the currents flowing through in-
dividual cells, as indicated in Fig. 8.16B. In the case when the voltage V mp of parallel con-
nected cells is the same, the output power will be the sum of output power of individual
cells, as indicated in Fig. 8.16C. Large area cells with inhomogeneous distribution of both
recombination centers and junction defects can also be considered as a number of paral-
lel connected cells with different parameters. Mismatch in cell parameters decreases the
output power and, therefore, homogeneity of large area cells is very important in reaching
high efficiencies.
note that even the characteristics of connected cells are the same at sTC, differenc-
es in cell characteristics can be initiated by external conditions. nonuniform irradiance