
Page 163 - A Comprehensive Guide to Solar Energy Systems
P. 163
164 A CoMPrehensIVe GuIde To soLAr enerGy sysTeMs
FIGURE 8.10 (A) The effect of the PN junction quality factor ζ on a PV cell I–V characteristics. (B) The effect of the
reverse current density J 0 on a PV cell I–V characteristics.
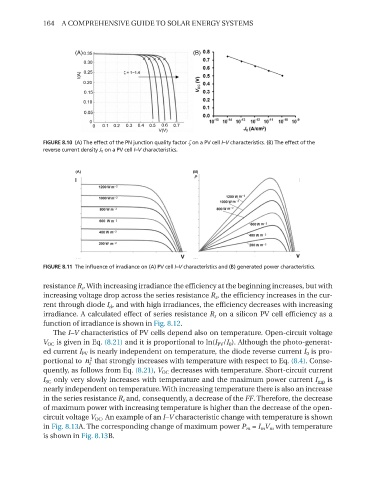
FIGURE 8.11 The influence of irradiance on (A) PV cell I–V characteristics and (B) generated power characteristics.
resistance R s . With increasing irradiance the efficiency at the beginning increases, but with
increasing voltage drop across the series resistance R s , the efficiency increases in the cur-
rent through diode I d , and with high irradiances, the efficiency decreases with increasing
irradiance. A calculated effect of series resistance R s on a silicon PV cell efficiency as a
function of irradiance is shown in Fig. 8.12.
The I–V characteristics of PV cells depend also on temperature. open-circuit voltage
V oC is given in eq. (8.21) and it is proportional to ln(I PV /I 0 ). Although the photo-generat-
ed current I PV is nearly independent on temperature, the diode reverse current I 0 is pro-
2
n2i portional to n that strongly increases with temperature with respect to eq. (8.4). Conse-
i
quently, as follows from eq. (8.21), V oC decreases with temperature. short-circuit current
I sC only very slowly increases with temperature and the maximum power current I mp is
nearly independent on temperature. With increasing temperature there is also an increase
in the series resistance R s and, consequently, a decrease of the FF. Therefore, the decrease
of maximum power with increasing temperature is higher than the decrease of the open-
circuit voltage V oC . An example of an I–V characteristic change with temperature is shown
in Fig. 8.13A. The corresponding change of maximum power P m = I m V m with temperature
is shown in Fig. 8.13B.