
Page 306 - A Comprehensive Guide to Solar Energy Systems
P. 306
310 A ComPreHenSIVe GuIde To SolAr enerGy SySTemS
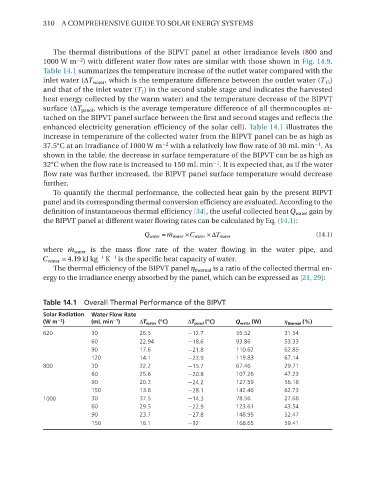
The thermal distributions of the BIPVT panel at other irradiance levels (800 and
−2
1000 W m ) with different water flow rates are similar with those shown in Fig. 14.9.
Table 14.1 summarizes the temperature increase of the outlet water compared with the
∆
∆Twater inlet water ( T water , which is the temperature difference between the outlet water (T 15 )
and that of the inlet water (T 1 ) in the second stable stage and indicates the harvested
heat energy collected by the warm water) and the temperature decrease of the BIPVT
∆
∆Tpanel surface ( T panel , which is the average temperature difference of all thermocouples at-
tached on the BIPVT panel surface between the first and second stages and reflects the
enhanced electricity generation efficiency of the solar cell). Table 14.1 illustrates the
increase in temperature of the collected water from the BIPVT panel can be as high as
−2
−1
37.5°C at an irradiance of 1000 W m with a relatively low flow rate of 30 ml min . As
shown in the table, the decrease in surface temperature of the BIPVT can be as high as
−1
32°C when the flow rate is increased to 150 ml min . It is expected that, as if the water
flow rate was further increased, the BIPVT panel surface temperature would decrease
further.
To quantify the thermal performance, the collected heat gain by the present BIPVT
panel and its corresponding thermal conversion efficiency are evaluated. According to the
Qwater definition of instantaneous thermal efficiency [34], the useful collected heat Q water gain by
the BIPVT panel at different water flowing rates can be calculated by eq. (14.1):
Qwater=m˙water×Cwater×∆Twater Q water = m wate × C water ×∆ T water (14.1)
r
m˙water where m water is the mass flow rate of the water flowing in the water pipe, and
−1
−1
Cwater=4.19 C water = 4.19 kJ kg K is the specific heat capacity of water.
η
ηthermal The thermal efficiency of the BIPVT panel thermal is a ratio of the collected thermal en-
ergy to the irradiance energy absorbed by the panel, which can be expressed as [21, 29]:
Table 14.1 Overall Thermal Performance of the BIPVT
Solar Radiation Water Flow Rate
η ∆ Qwater (W m ) (mL min ) ∆ T water (°C) ∆ T panel (°C) Q water (W) η thermal (%)
−2
−1
∆Twater
panel
thermal
T
620 30 26.5 −12.7 55.52 31.54
60 22.94 −18.6 93.86 53.33
90 17.6 −21.8 110.62 62.85
120 14.1 −23.9 119.83 67.14
800 30 32.2 −15.7 67.46 29.71
60 25.6 −20.8 107.26 47.23
90 20.3 −24.2 127.59 56.18
150 13.6 −28.1 142.46 62.73
1000 30 37.5 −14.3 78.56 27.68
60 29.5 −22.9 123.61 43.54
90 23.7 −27.8 148.95 52.47
150 16.1 −32 168.65 59.41