
Page 304 - A Comprehensive Guide to Solar Energy Systems
P. 304
308 A ComPreHenSIVe GuIde To SolAr enerGy SySTemS
the selected height. A water source was connected to the inlet of the panel to cool down
the surface temperature of the FGm panel as well as the solar cell. A laboratory flowmeter
−1
(Fig. 14.7B) with a flow range of 2–250 ml min and accuracy of 2% was used to control
the flowrate inside the water tube.
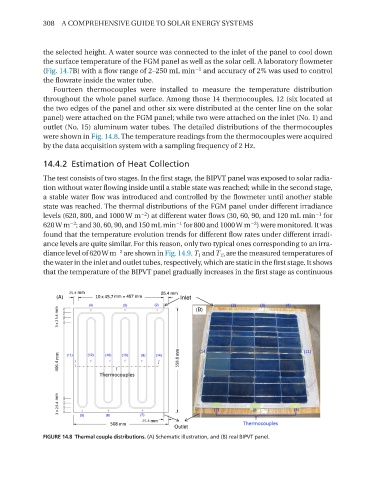
Fourteen thermocouples were installed to measure the temperature distribution
throughout the whole panel surface. Among those 14 thermocouples, 12 (six located at
the two edges of the panel and other six were distributed at the center line on the solar
panel) were attached on the FGm panel; while two were attached on the inlet (no. 1) and
outlet (no. 15) aluminum water tubes. The detailed distributions of the thermocouples
were shown in Fig. 14.8. The temperature readings from the thermocouples were acquired
by the data acquisition system with a sampling frequency of 2 Hz.
14.4.2 Estimation of Heat Collection
The test consists of two stages. In the first stage, the BIPVT panel was exposed to solar radia-
tion without water flowing inside until a stable state was reached; while in the second stage,
a stable water flow was introduced and controlled by the flowmeter until another stable
state was reached. The thermal distributions of the FGm panel under different irradiance
−2
−1
levels (620, 800, and 1000 W m ) at different water flows (30, 60, 90, and 120 ml min for
−2
−1
−2
620 W m ; and 30, 60, 90, and 150 ml min for 800 and 1000 W m ) were monitored. It was
found that the temperature evolution trends for different flow rates under different irradi-
ance levels are quite similar. For this reason, only two typical ones corresponding to an irra-
−2
diance level of 620 W m are shown in Fig. 14.9. T 1 and T 15 are the measured temperatures of
the water in the inlet and outlet tubes, respectively, which are static in the first stage. It shows
that the temperature of the BIPVT panel gradually increases in the first stage as continuous
FIGURE 14.8 Thermal couple distributions. (A) Schematic illustration, and (B) real BIPVT panel.