
Page 305 - A Comprehensive Guide to Solar Energy Systems
P. 305
Chapter 14 • Advanced Building Integrated Photovoltaic/Thermal Technologies 309
−2
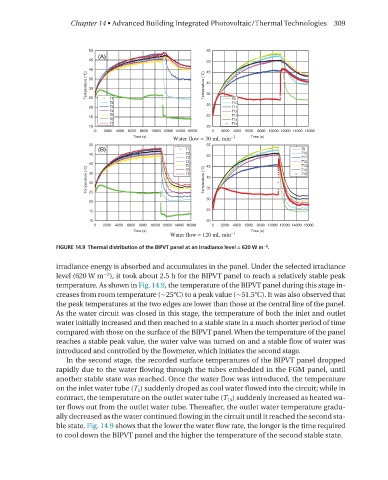
FIGURE 14.9 Thermal distribution of the BIPVT panel at an irradiance level = 620 W m .
irradiance energy is absorbed and accumulates in the panel. under the selected irradiance
−2
level (620 W m ), it took about 2.5 h for the BIPVT panel to reach a relatively stable peak
temperature. As shown in Fig. 14.9, the temperature of the BIPVT panel during this stage in-
creases from room temperature (∼25°C) to a peak value (∼51.5°C). It was also observed that
the peak temperatures at the two edges are lower than those at the central line of the panel.
As the water circuit was closed in this stage, the temperature of both the inlet and outlet
water initially increased and then reached to a stable state in a much shorter period of time
compared with those on the surface of the BIPVT panel. When the temperature of the panel
reaches a stable peak value, the water valve was turned on and a stable flow of water was
introduced and controlled by the flowmeter, which initiates the second stage.
In the second stage, the recorded surface temperatures of the BIPVT panel dropped
rapidly due to the water flowing through the tubes embedded in the FGm panel, until
another stable state was reached. once the water flow was introduced, the temperature
on the inlet water tube (T 1 ) suddenly droped as cool water flowed into the circuit; while in
contract, the temperature on the outlet water tube (T 15 ) suddenly increased as heated wa-
ter flows out from the outlet water tube. Thereafter, the outlet water temperature gradu-
ally decreased as the water continued flowing in the circuit until it reached the second sta-
ble state. Fig. 14.9 shows that the lower the water flow rate, the longer is the time required
to cool down the BIPVT panel and the higher the temperature of the second stable state.