
Page 347 - A Comprehensive Guide to Solar Energy Systems
P. 347
352 A COmPreHenSIVe GuIde TO SOLAr enerGy SySTemS
generating plants such as nuclear, coal, and natural gas combined cycle plants. Firstly, the
amount of energy storage capacity required will depend on grid flexibility. Secondly, it will
depend on attributes of the renewable generation. The amount, type, mix, and degree of
supply correlation affect how well supply satisfies demand. Today, storage on power grids
is dominated by pumped hydroelectric storage (PHS). Table 17.1 lists worldwide storage
capacity by power and energy. This chapter describes the effect storage has on the energy
and carbon intensity of solar PV-generated electricity. First, key storage characteristics are
listed. Second, energy return ratio results are presented. Third, carbon intensity calcula-
tions and results are presented.
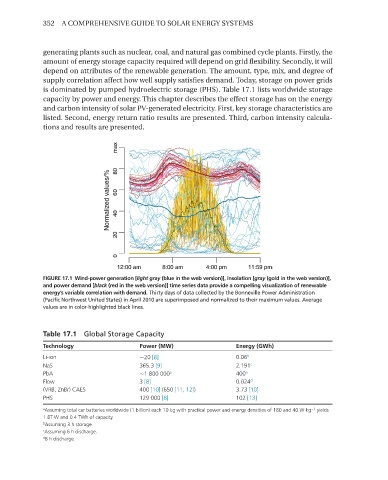
FIGURE 17.1 Wind-power generation [light gray (blue in the web version)], insolation [gray (gold in the web version)],
and power demand [black (red in the web version)] time series data provide a compelling visualization of renewable
energy’s variable correlation with demand. Thirty days of data collected by the Bonneville Power Administration
(Pacific Northwest United States) in April 2010 are superimposed and normalized to their maximum values. Average
values are in color-highlighted black lines.
Table 17.1 Global Storage Capacity
Technology Power (MW) Energy (GWh)
Li-ion ∼20 [8] 0.06 b
NaS 365.3 [9] 2.191 c
PbA ∼1 800 000 a 400 a
Flow 3 [8] 0.024 d
(VRB, ZnBr) CAES 400 [10] (650 [11, 12]) 3.73 [10]
PHS 129 000 [8] 102 [13]
−1
a Assuming total car batteries worldwide (1 billion) each 10 kg with practical power and energy densities of 180 and 40 W kg yields
1.8T W and 0.4 TWh of capacity.
b Assuming 3 h storage.
c Assuming 6 h discharge.
d 8 h discharge.