
Page 352 - A Comprehensive Guide to Solar Energy Systems
P. 352
Chapter 17 • Energy and Carbon Intensities of Stored Solar Photovoltaic Energy 357
storage technologies were obtained from LCA and neA studies [14–17]. Carbon intensity
values for the average uS power grid emissions and subgrid emissions were obtained from
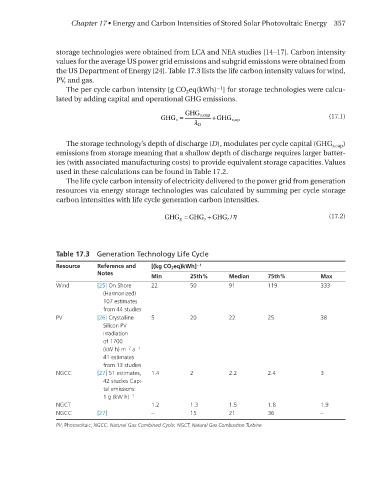
the uS department of energy [24]. Table 17.3 lists the life carbon intensity values for wind,
PV, and gas.
−1
The per cycle carbon intensity [g CO 2 eq(kWh) ] for storage technologies were calcu-
lated by adding capital and operational GHG emissions.
GHG s = GHG s,cap + (17.1) GHGs=GHGs,capλD+GHGs,op
λ D GHG s,op
The storage technology’s depth of discharge (D), modulates per cycle capital (GHG s,cap )
emissions from storage meaning that a shallow depth of discharge requires larger batter-
ies (with associated manufacturing costs) to provide equivalent storage capacities. Values
used in these calculations can be found in Table 17.2.
The life cycle carbon intensity of electricity delivered to the power grid from generation
resources via energy storage technologies was calculated by summing per cycle storage
carbon intensities with life cycle generation carbon intensities.
+ GHG/ η (17.2) GHGg=GHGs+GHGr/η
GHG g = GHG s r
Table 17.3 Generation Technology Life Cycle
Resource Reference and [(kg CO 2 eq)kWh] −1
Notes
Min 25th% Median 75th% Max
Wind [25] On Shore 22 50 91 119 333
(Harmonized)
107 estimates
from 44 studies
PV [26] Crystalline 5 20 22 25 38
Silicon PV
irradiation
of 1700
−1
−2
(kW h) m a
41 estimates
from 13 studies
NGCC [27] 51 estimates, 1.4 2 2.2 2.4 3
42 studies Capi-
tal emissions:
1 g (kW h) −1
NGCT 1.2 1.3 1.5 1.8 1.9
NGCC [27] – 15 21 36 –
PV, Photovoltaic; NGCC, Natural Gas Combined Cycle; NGCT, Natural Gas Combustion Turbine.