
Page 348 - A Comprehensive Guide to Solar Energy Systems
P. 348
Chapter 17 • Energy and Carbon Intensities of Stored Solar Photovoltaic Energy 353
17.2 Key Characteristics for Storage
energy storage incurs energetic costs and emits carbon to the atmosphere. direct emissions
of carbon are those associated with the round-trip efficiency and operation of the storage
device. Indirect emissions are those resulting from the process of mining the materials and
manufacturing the storage and flexible generation technologies. The energetic and carbon
intensity values for energy storage technologies were obtained from life cycle assessment
(LCA) and net energy analysis (neA); studies [14–17]. Grid-scale storage requires safety,
affordability, reliability, longevity, and efficiency. Technologies that satisfy these criteria
include four electrochemical storage technologies—lithium-ion (Li-ion), sodium sulfur,
traditional lead-acid (PbA), vanadium redox flow batteries (VrB)—and two geological stor-
age technologies—PHS, and compressed air energy storage (CAeS)—in this analysis.
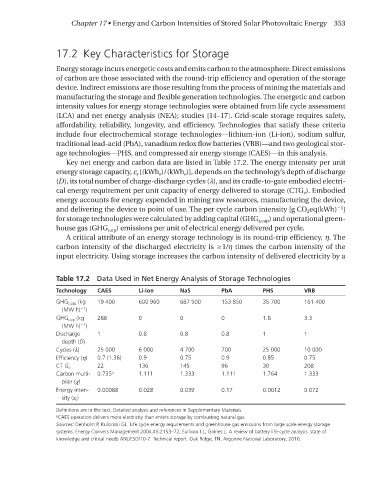
Key net energy and carbon data are listed in Table 17.2. The energy intensity per unit
energy storage capacity, ε s [(kWh e )/(kWh e )], depends on the technology’s depth of discharge
(D), its total number of charge-discharge cycles (λ), and its cradle-to-gate embodied electri-
cal energy requirement per unit capacity of energy delivered to storage (CTG e ). embodied
energy accounts for energy expended in mining raw resources, manufacturing the device,
−1
and delivering the device to point of use. The per cycle carbon intensity [g CO 2 eq(kWh) ]
for storage technologies were calculated by adding capital (GHG s,cap ) and operational green-
house gas (GHG s,op ) emissions per unit of electrical energy delivered per cycle.
A critical attribute of an energy storage technology is its round-trip efficiency, η. The
carbon intensity of the discharged electricity is ≥1/η times the carbon intensity of the
input electricity. using storage increases the carbon intensity of delivered electricity by a
Table 17.2 Data Used in Net Energy Analysis of Storage Technologies
Technology CAES Li-ion NaS PbA PHS VRB
GHG s,cap (kg 19 400 600 960 687 500 153 850 35 700 161 400
(MW h) )
−1
GHG s,op (kg 288 0 0 0 1.8 3.3
(MW h) )
−1
Discharge 1 0.8 0.8 0.8 1 1
depth (D)
Cycles (λ) 25 000 6 000 4 700 700 25 000 10 000
Efficiency (η) 0.7 (1.36) 0.9 0.75 0.9 0.85 0.75
22 136 145 96 30 208
CT G e
Carbon multi- 0.735 a 1.111 1.333 1.111 1.764 1.333
plier (χ)
Energy inten- 0.00088 0.028 0.039 0.17 0.0012 0.072
sity (ε s )
Definitions are in the text. Detailed analysis and references in Supplementary Materials.
a CAES operation delivers more electricity than enters storage by combusting natural gas.
Sources: Denholm P, Kulcinski GL. Life cycle energy requirements and greenhouse gas emissions from large scale energy storage
systems. Energy Convers Management 2004;45:2153–72, Sullivan J.L, Gaines L. A review of battery life-cycle analysis: state of
knowledge and critical needs ANL/ESD/10-7. Technical report. Oak Ridge, TN: Argonne National Laboratory; 2010.