
Page 353 - A Comprehensive Guide to Solar Energy Systems
P. 353
358 A COmPreHenSIVe GuIde TO SOLAr enerGy SySTemS
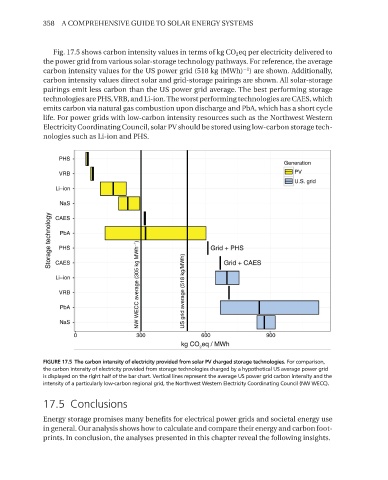
Fig. 17.5 shows carbon intensity values in terms of kg CO 2 eq per electricity delivered to
the power grid from various solar-storage technology pathways. For reference, the average
−1
carbon intensity values for the uS power grid (518 kg (mWh) ) are shown. Additionally,
carbon intensity values direct solar and grid-storage pairings are shown. All solar-storage
pairings emit less carbon than the uS power grid average. The best performing storage
technologies are PHS, VrB, and Li-ion. The worst performing technologies are CAeS, which
emits carbon via natural gas combustion upon discharge and PbA, which has a short cycle
life. For power grids with low-carbon intensity resources such as the northwest Western
electricity Coordinating Council, solar PV should be stored using low-carbon storage tech-
nologies such as Li-ion and PHS.
FIGURE 17.5 The carbon intensity of electricity provided from solar PV charged storage technologies. For comparison,
the carbon intensity of electricity provided from storage technologies charged by a hypothetical US average power grid
is displayed on the right half of the bar chart. Vertical lines represent the average US power grid carbon intensity and the
intensity of a particularly low-carbon regional grid, the Northwest Western Electricity Coordinating Council (NW WECC).
17.5 Conclusions
energy storage promises many benefits for electrical power grids and societal energy use
in general. Our analysis shows how to calculate and compare their energy and carbon foot-
prints. In conclusion, the analyses presented in this chapter reveal the following insights.