
Page 350 - A Comprehensive Guide to Solar Energy Systems
P. 350
Chapter 17 • Energy and Carbon Intensities of Stored Solar Photovoltaic Energy 355
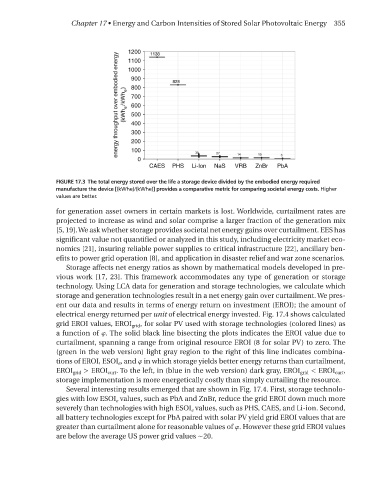
FIGURE 17.3 The total energy stored over the life a storage device divided by the embodied energy required
manufacture the device [(kWhe)/(kWhe)] provides a comparative metric for comparing societal energy costs. Higher
values are better.
for generation asset owners in certain markets is lost. Worldwide, curtailment rates are
projected to increase as wind and solar comprise a larger fraction of the generation mix
[5, 19]. We ask whether storage provides societal net energy gains over curtailment. eeS has
significant value not quantified or analyzed in this study, including electricity market eco-
nomics [21], insuring reliable power supplies to critical infrastructure [22], ancillary ben-
efits to power grid operation [8], and application in disaster relief and war zone scenarios.
Storage affects net energy ratios as shown by mathematical models developed in pre-
vious work [17, 23]. This framework accommodates any type of generation or storage
technology. using LCA data for generation and storage technologies, we calculate which
storage and generation technologies result in a net energy gain over curtailment. We pres-
ent our data and results in terms of energy return on investment (erOI); the amount of
electrical energy returned per unit of electrical energy invested. Fig. 17.4 shows calculated
grid erOI values, erOI grid , for solar PV used with storage technologies (colored lines) as
a function of . The solid black line bisecting the plots indicates the erOI value due to
curtailment, spanning a range from original resource erOI (8 for solar PV) to zero. The
(green in the web version) light gray region to the right of this line indicates combina-
tions of erOI, eSOI e , and in which storage yields better energy returns than curtailment,
erOI grid > erOI curt . To the left, in (blue in the web version) dark gray, erOI grid < erOI curt ,
storage implementation is more energetically costly than simply curtailing the resource.
Several interesting results emerged that are shown in Fig. 17.4. First, storage technolo-
gies with low eSOI e values, such as PbA and ZnBr, reduce the grid erOI down much more
severely than technologies with high eSOI e values, such as PHS, CAeS, and Li-ion. Second,
all battery technologies except for PbA paired with solar PV yield grid erOI values that are
greater than curtailment alone for reasonable values of . However these grid erOI values
are below the average uS power grid values ∼20.