
Page 449 - A Comprehensive Guide to Solar Energy Systems
P. 449
Chapter 23 • Materials: Abundance, Purification, and the Energy Cost 461
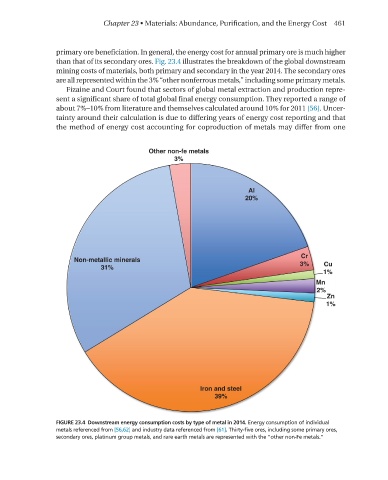
primary ore beneficiation. In general, the energy cost for annual primary ore is much higher
than that of its secondary ores. Fig. 23.4 illustrates the breakdown of the global downstream
mining costs of materials, both primary and secondary in the year 2014. The secondary ores
are all represented within the 3% “other nonferrous metals,” including some primary metals.
Fizaine and Court found that sectors of global metal extraction and production repre-
sent a significant share of total global final energy consumption. They reported a range of
about 7%–10% from literature and themselves calculated around 10% for 2011 [56]. uncer-
tainty around their calculation is due to differing years of energy cost reporting and that
the method of energy cost accounting for coproduction of metals may differ from one
FIGURE 23.4 Downstream energy consumption costs by type of metal in 2014. Energy consumption of individual
metals referenced from [56,62] and industry data referenced from [61]. Thirty-five ores, including some primary ores,
secondary ores, platinum group metals, and rare earth metals are represented with the “other non-Fe metals.”