
Page 451 - A Comprehensive Guide to Solar Energy Systems
P. 451
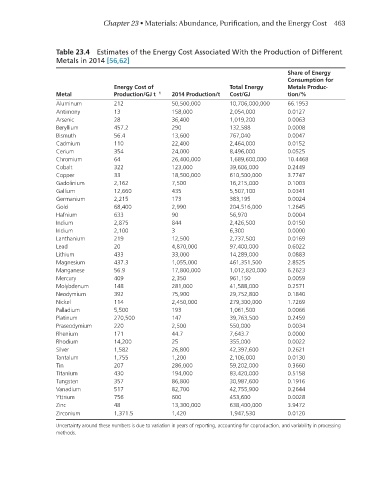
Chapter 23 • Materials: Abundance, Purification, and the Energy Cost  463


                 Table 23.4  Estimates of the Energy Cost Associated With the Production of Different
                 Metals in 2014 [56,62]
                                                                                 Share of Energy
                                                                                 Consumption for
                                 Energy Cost of                  Total Energy    Metals Produc-
                 Metal           Production/GJ t −1  2014 Production/t  Cost/GJ  tion/%
                 Aluminum        212             50,500,000      10,706,000,000  66.1953
                 Antimony        13              158,000         2,054,000       0.0127
                 Arsenic         28              36,400          1,019,200       0.0063
                 Beryllium       457.2           290             132,588         0.0008
                 Bismuth         56.4            13,600          767,040         0.0047
                 Cadmium         110             22,400          2,464,000       0.0152
                 Cerium          354             24,000          8,496,000       0.0525
                 Chromium        64              26,400,000      1,689,600,000   10.4468
                 Cobalt          322             123,000         39,606,000      0.2449
                 Copper          33              18,500,000      610,500,000     3.7747
                 Gadolinium      2,162           7,500           16,215,000      0.1003
                 Gallium         12,660          435             5,507,100       0.0341
                 Germanium       2,215           173             383,195         0.0024
                 Gold            68,400          2,990           204,516,000     1.2645
                 Hafnium         633             90              56,970          0.0004
                 Indium          2,875           844             2,426,500       0.0150
                 Iridium         2,100           3               6,300           0.0000
                 Lanthanium      219             12,500          2,737,500       0.0169
                 Lead            20              4,870,000       97,400,000      0.6022
                 Lithium         433             33,000          14,289,000      0.0883
                 Magnesium       437.3           1,055,000       461,351,500     2.8525
                 Manganese       56.9            17,800,000      1,012,820,000   6.2623
                 Mercury         409             2,350           961,150         0.0059
                 Molybdenum      148             281,000         41,588,000      0.2571
                 Neodymium       392             75,900          29,752,800      0.1840
                 Nickel          114             2,450,000       279,300,000     1.7269
                 Palladium       5,500           193             1,061,500       0.0066
                 Platinum        270,500         147             39,763,500      0.2459
                 Praseodymium    220             2,500           550,000         0.0034
                 Rhenium         171             44.7            7,643.7         0.0000
                 Rhodium         14,200          25              355,000         0.0022
                 Silver          1,582           26,800          42,397,600      0.2621
                 Tantalum        1,755           1,200           2,106,000       0.0130
                 Tin             207             286,000         59,202,000      0.3660
                 Titanium        430             194,000         83,420,000      0.5158
                 Tungsten        357             86,800          30,987,600      0.1916
                 Vanadium        517             82,700          42,755,900      0.2644
                 Yttrium         756             600             453,600         0.0028
                 Zinc            48              13,300,000      638,400,000     3.9472
                 Zirconium       1,371.5         1,420           1,947,530       0.0120
                 Uncertainty around these numbers is due to variation in years of reporting, accounting for coproduction, and variability in processing
                 methods.