
Page 59 - A Comprehensive Guide to Solar Energy Systems
P. 59
54 A COmPrEHENSIVE GUIDE TO SOlAr ENErGy SySTEmS
Table 4.1 Change in US Generation From Major Fuel Type Across Markets,
2009–2014 [2]
Nonhydro
Coal Natural Gas Nuclear Renewable Total
Absolute Absolute Absolute Absolute Absolute
Change Percent Change Percent Change Percent Change Percent Change Percent
(TWh) Change (TWh) Change (TWh) Change (TWh) Change (TWh) Change
US −171.3 −10 204.6 22 −1.7 0 130.8 85 132 3
WECC −13.8 −6 −4.3 −2 −10.3 −15 43.4 92 11.9 2
SERC −53.9 −11 94.8 51 3.8 1 12.7 52 49.8 5
RFC −83 −15 65.1 85 12.1 5 17.5 102 13.5 1
NPCC −17.4 −62 11.8 12 0.2 0 14.5 148 −6.4 −2
SPP −0.8 −1 −5.7 −10 −0.2 −2 4 29 3.4 2
MRO −9.6 −6 2.7 31 −3.9 −11 19.2 105 12.2 6
FRCC −4.1 −7 30.6 29 −1.2 −4 0 −1 9.7 4
TRE 11.4 10 9.7 6 −2.2 −5 19.4 105 37.8 12
Alaska −0.1 −11 −0.3 −8 0 0 0.2 1,484 −0.7 −10
Hawaii 0 1 0 0 0 0 0.5 74 −1.3 12
FRCC, Florida Reliability Coordinating Council; MRO, Midwest Reliability Organization; NPCC, Northeast Power Coordinating Council;
RFC, ReliabilityFirst Corporation; SERC, SERC Reliability Corporation; SPP, Southwest Power Pool; TRE, Texas Reliability Entity; TWh,
terawatt-hours; WECC, Western Electricity Coordinating Council.
In recent years, the electricity generation mix in the western United States has shifted from fossil fuels and nuclear power to nonhydro
renewables. In the eastern part of the United States, generation has shifted primarily from coal to natural gas. Texas has seen a growth
in generation from both coal and nonhydro renewables.
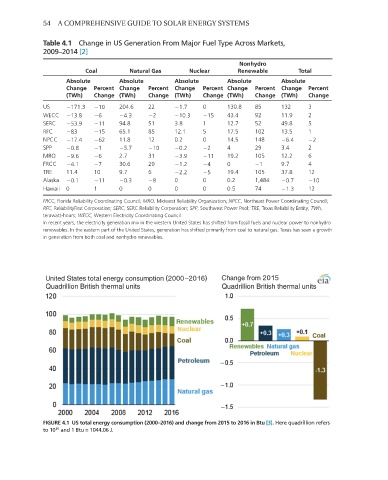
FIGURE 4.1 US total energy consumption (2000–2016) and change from 2015 to 2016 in Btu [3]. Here quadrillion refers
to 10 and 1 Btu = 1044.06 J.
15