
Page 61 - A Comprehensive Guide to Solar Energy Systems
P. 61
56 A COmPrEHENSIVE GUIDE TO SOlAr ENErGy SySTEmS
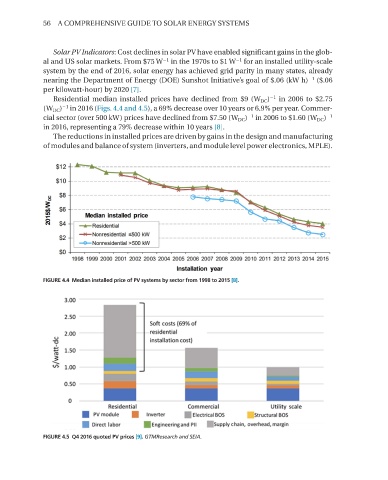
Solar PV Indicators: Cost declines in solar PV have enabled significant gains in the glob-
−1
−1
al and US solar markets. From $75 W in the 1970s to $1 W for an installed utility-scale
system by the end of 2016, solar energy has achieved grid parity in many states, already
−1
nearing the Department of Energy (DOE) Sunshot Initiative’s goal of $.06 (kW h) ($.06
per kilowatt-hour) by 2020 [7].
−1
residential median installed prices have declined from $9 (W DC ) in 2006 to $2.75
−1
(W DC ) in 2016 (Figs. 4.4 and 4.5), a 69% decrease over 10 years or 6.9% per year. Commer-
−1
−1
cial sector (over 500 kW) prices have declined from $7.50 (W DC ) in 2006 to $1.60 (W DC )
in 2016, representing a 79% decrease within 10 years [8].
The reductions in installed prices are driven by gains in the design and manufacturing
of modules and balance of system (inverters, and module level power electronics, mPlE).
FIGURE 4.4 Median installed price of PV systems by sector from 1998 to 2015 [8].
FIGURE 4.5 Q4 2016 quoted PV prices [9]. GTMResearch and SEIA.