
Page 66 - A Comprehensive Guide to Solar Energy Systems
P. 66
Chapter 4 • Solar Power in the USA—Status and Outlook 61
arises for modernization of the grid and new models for energy valuation and transaction
between producers and consumers, as discussed in Section 4.3 of this chapter.
4.1.1 Reducing Soft Costs
Basic research and improvements in the manufacturing process have greatly accelerated
PV adoption. In the rapid decline of material costs, the US PV industry has encountered
an arguably more complex obstacle—disorganization and fragmentation. Q4 2016 quoted
PV prices showed that soft costs (direct labor, engineering and PII, supply chain, overhead,
and margin) comprised over half of installed prices in both the residential and commercial
sectors, and an astounding 69% of quoted residential prices (see Figure 5 in reference) [9].
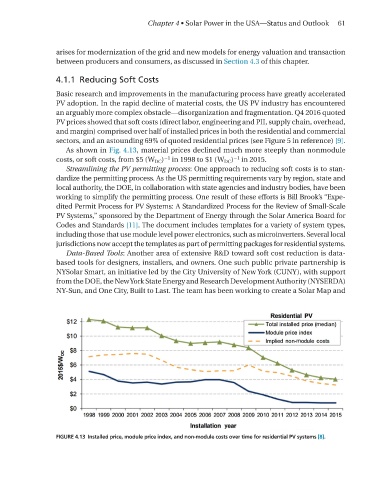
As shown in Fig. 4.13, material prices declined much more steeply than nonmodule
−1
−1
costs, or soft costs, from $5 (W DC ) in 1998 to $1 (W DC ) in 2015.
Streamlining the PV permitting process: One approach to reducing soft costs is to stan-
dardize the permitting process. As the US permitting requirements vary by region, state and
local authority, the DOE, in collaboration with state agencies and industry bodies, have been
working to simplify the permitting process. One result of these efforts is Bill Brook’s “Expe-
dited Permit Process for PV Systems: A Standardized Process for the review of Small-Scale
PV Systems,” sponsored by the Department of Energy through the Solar America Board for
Codes and Standards [11]. The document includes templates for a variety of system types,
including those that use module level power electronics, such as microinverters. Several local
jurisdictions now accept the templates as part of permitting packages for residential systems.
Data-Based Tools: Another area of extensive r&D toward soft cost reduction is data-
based tools for designers, installers, and owners. One such public private partnership is
NySolar Smart, an initiative led by the City University of New york (CUNy), with support
from the DOE, the New york State Energy and research Development Authority (NySErDA)
Ny-Sun, and One City, Built to last. The team has been working to create a Solar map and
FIGURE 4.13 Installed price, module price index, and non-module costs over time for residential PV systems [8].