
Page 71 - A Comprehensive Guide to Solar Energy Systems
P. 71
66 A COmPrEHENSIVE GUIDE TO SOlAr ENErGy SySTEmS
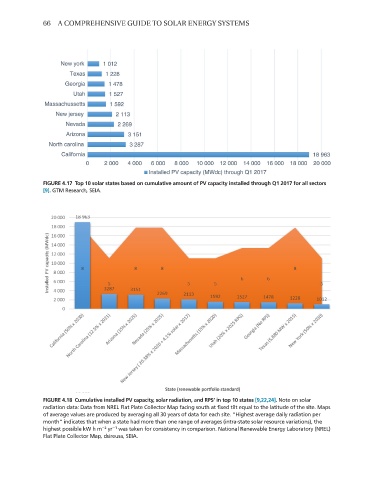
FIGURE 4.17 Top 10 solar states based on cumulative amount of PV capacity installed through Q1 2017 for all sectors
[9]. GTM Research, SEIA.
FIGURE 4.18 Cumulative installed PV capacity, solar radiation, and RPS’ in top 10 states [9,22,24]. Note on solar
radiation data: Data from NREL Flat Plate Collector Map facing south at fixed tilt equal to the latitude of the site. Maps
of average values are produced by averaging all 30 years of data for each site. “Highest average daily radiation per
month” indicates that when a state had more than one range of averages (intra-state solar resource variations), the
−2
−1
highest possible kW h m yr was taken for consistency in comparison. National Renewable Energy Laboratory (NREL)
Flat Plate Collector Map, dsireusa, SEIA.