
Page 70 - A Comprehensive Guide to Solar Energy Systems
P. 70
Chapter 4 • Solar Power in the USA—Status and Outlook 65
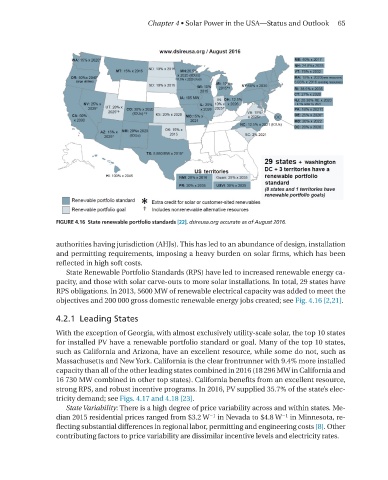
FIGURE 4.16 State renewable portfolio standards [22]. dsireusa.org accurate as of August 2016.
authorities having jurisdiction (AHJs). This has led to an abundance of design, installation
and permitting requirements, imposing a heavy burden on solar firms, which has been
reflected in high soft costs.
State renewable Portfolio Standards (rPS) have led to increased renewable energy ca-
pacity, and those with solar carve-outs to more solar installations. In total, 29 states have
rPS obligations. In 2013, 5600 mW of renewable electrical capacity was added to meet the
objectives and 200 000 gross domestic renewable energy jobs created; see Fig. 4.16 [2,21].
4.2.1 Leading States
With the exception of Georgia, with almost exclusively utility-scale solar, the top 10 states
for installed PV have a renewable portfolio standard or goal. many of the top 10 states,
such as California and Arizona, have an excellent resource, while some do not, such as
massachusetts and New york. California is the clear frontrunner with 9.4% more installed
capacity than all of the other leading states combined in 2016 (18 296 mW in California and
16 730 mW combined in other top states). California benefits from an excellent resource,
strong rPS, and robust incentive programs. In 2016, PV supplied 35.7% of the state’s elec-
tricity demand; see Figs. 4.17 and 4.18 [23].
State Variability: There is a high degree of price variability across and within states. me-
dian 2015 residential prices ranged from $3.2 W in Nevada to $4.8 W in minnesota, re-
−1
−1
flecting substantial differences in regional labor, permitting and engineering costs [8]. Other
contributing factors to price variability are dissimilar incentive levels and electricity rates.