
Page 65 - A Comprehensive Guide to Solar Energy Systems
P. 65
60 A COmPrEHENSIVE GUIDE TO SOlAr ENErGy SySTEmS
relative to the AC capacity of the inverter during peak production, the use of more mod-
ules enables the inverter to operate closer to its peak rating more often, particularly during
morning and afternoon hours when solar insolation is lowest. The increased revenue gener-
ated during the morning and afternoon hours has outweighed the clipping losses during the
hours of greatest insolation, 9 Am to 3 Pm, in summer months. This is increasingly valuable
as grid operators require high ramp rates from other generators during these times. In 2015,
average Ilrs fixed-tilt and tracking PV increased to 1.31% from 1.2% in 2010 [10].
Another indication of the grid parity of solar is decreasing Power Purchase Agreement
(PPA) prices due to falling hard costs, narrowing the gap between solar PPAs and existing
−1
−1
gas-fired generators. Prices are down from $100 (mW h) in 2011 to as low as $30 (mW h)
in 2015 [10].
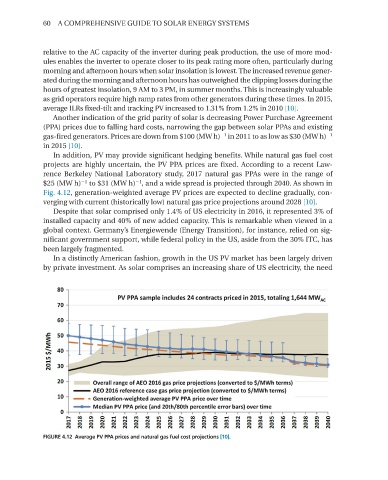
In addition, PV may provide significant hedging benefits. While natural gas fuel cost
projects are highly uncertain, the PV PPA prices are fixed. According to a recent law-
rence Berkeley National laboratory study, 2017 natural gas PPAs were in the range of
−1
−1
$25 (mW h) to $31 (mW h) , and a wide spread is projected through 2040. As shown in
Fig. 4.12, generation-weighted average PV prices are expected to decline gradually, con-
verging with current (historically low) natural gas price projections around 2028 [10].
Despite that solar comprised only 1.4% of US electricity in 2016, it represented 3% of
installed capacity and 40% of new added capacity. This is remarkable when viewed in a
global context. Germany’s Energiewende (Energy Transition), for instance, relied on sig-
nificant government support, while federal policy in the US, aside from the 30% ITC, has
been largely fragmented.
In a distinctly American fashion, growth in the US PV market has been largely driven
by private investment. As solar comprises an increasing share of US electricity, the need
FIGURE 4.12 Average PV PPA prices and natural gas fuel cost projections [10].