
Page 62 - A Comprehensive Guide to Solar Energy Systems
P. 62
Chapter 4 • Solar Power in the USA—Status and Outlook 57
These efficiencies enabled the installation of 14.8 GW DC of PV in the US in 2016, a 97%
increase over 2015, bringing cumulative installed capacity to 40.4 GW DC , of which 2016
9
contributions were an astounding 37%. Significant private investment, $30 × 10 ($30
6
billion) in deployed capital, was leveraged in 2016 to install over 1.25 × 10 (1.25 million)
PV systems, making the US the second highest in annual installations behind China [8].
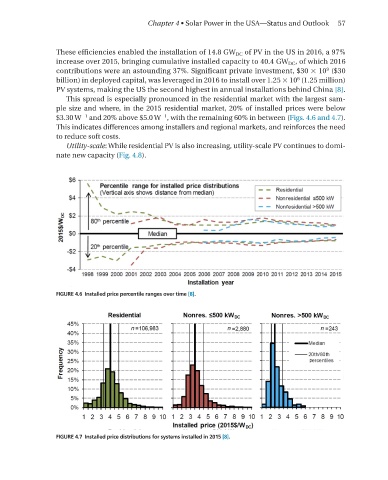
This spread is especially pronounced in the residential market with the largest sam-
ple size and where, in the 2015 residential market, 20% of installed prices were below
−1
−1
$3.30 W and 20% above $5.0 W , with the remaining 60% in between (Figs. 4.6 and 4.7).
This indicates differences among installers and regional markets, and reinforces the need
to reduce soft costs.
Utility-scale: While residential PV is also increasing, utility-scale PV continues to domi-
nate new capacity (Fig. 4.8).
FIGURE 4.6 Installed price percentile ranges over time [8].
FIGURE 4.7 Installed price distributions for systems installed in 2015 [8].