
Page 60 - A Comprehensive Guide to Solar Energy Systems
P. 60
Chapter 4 • Solar Power in the USA—Status and Outlook 55
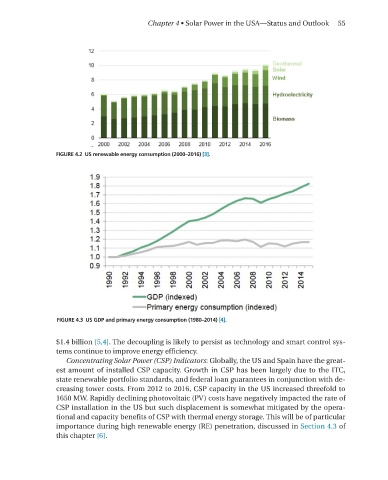
FIGURE 4.2 US renewable energy consumption (2000–2016) [3].
FIGURE 4.3 US GDP and primary energy consumption (1980–2014) [4].
$1.4 billion [5,4]. The decoupling is likely to persist as technology and smart control sys-
tems continue to improve energy efficiency.
Concentrating Solar Power (CSP) Indicators: Globally, the US and Spain have the great-
est amount of installed CSP capacity. Growth in CSP has been largely due to the ITC,
state renewable portfolio standards, and federal loan guarantees in conjunction with de-
creasing tower costs. From 2012 to 2016, CSP capacity in the US increased threefold to
1650 mW. rapidly declining photovoltaic (PV) costs have negatively impacted the rate of
CSP installation in the US but such displacement is somewhat mitigated by the opera-
tional and capacity benefits of CSP with thermal energy storage. This will be of particular
importance during high renewable energy (rE) penetration, discussed in Section 4.3 of
this chapter [6].