
Page 63 - A Comprehensive Guide to Solar Energy Systems
P. 63
58 A COmPrEHENSIVE GUIDE TO SOlAr ENErGy SySTEmS
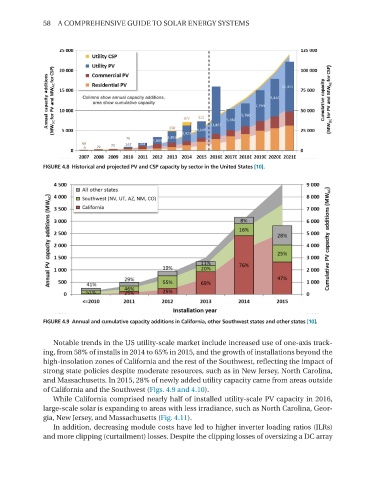
FIGURE 4.8 Historical and projected PV and CSP capacity by sector in the United States [10].
FIGURE 4.9 Annual and cumulative capacity additions in California, other Southwest states and other states [10].
Notable trends in the US utility-scale market include increased use of one-axis track-
ing, from 58% of installs in 2014 to 65% in 2015, and the growth of installations beyond the
high-insolation zones of California and the rest of the Southwest, reflecting the impact of
strong state policies despite moderate resources, such as in New Jersey, North Carolina,
and massachusetts. In 2015, 28% of newly added utility capacity came from areas outside
of California and the Southwest (Figs. 4.9 and 4.10).
While California comprised nearly half of installed utility-scale PV capacity in 2016,
large-scale solar is expanding to areas with less irradiance, such as North Carolina, Geor-
gia, New Jersey, and massachusetts (Fig. 4.11).
In addition, decreasing module costs have led to higher inverter loading ratios (Ilrs)
and more clipping (curtailment) losses. Despite the clipping losses of oversizing a DC array