
Page 74 - A Comprehensive Guide to Solar Energy Systems
P. 74
Chapter 4 • Solar Power in the USA—Status and Outlook 69
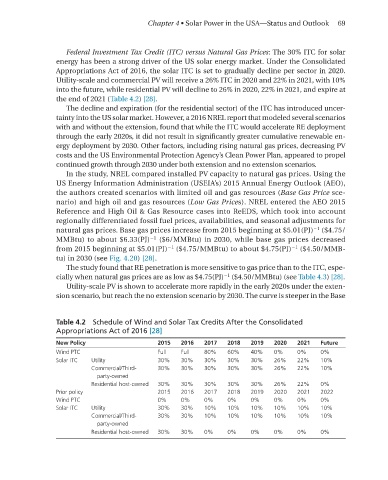
Federal Investment Tax Credit (ITC) versus Natural Gas Prices: The 30% ITC for solar
energy has been a strong driver of the US solar energy market. Under the Consolidated
Appropriations Act of 2016, the solar ITC is set to gradually decline per sector in 2020.
Utility-scale and commercial PV will receive a 26% ITC in 2020 and 22% in 2021, with 10%
into the future, while residential PV will decline to 26% in 2020, 22% in 2021, and expire at
the end of 2021 (Table 4.2) [28].
The decline and expiration (for the residential sector) of the ITC has introduced uncer-
tainty into the US solar market. However, a 2016 NrEl report that modeled several scenarios
with and without the extension, found that while the ITC would accelerate rE deployment
through the early 2020s, it did not result in significantly greater cumulative renewable en-
ergy deployment by 2030. Other factors, including rising natural gas prices, decreasing PV
costs and the US Environmental Protection Agency’s Clean Power Plan, appeared to propel
continued growth through 2030 under both extension and no extension scenarios.
In the study, NrEl compared installed PV capacity to natural gas prices. Using the
US Energy Information Administration (USEIA’s) 2015 Annual Energy Outlook (AEO),
the authors created scenarios with limited oil and gas resources (Base Gas Price sce-
nario) and high oil and gas resources (Low Gas Prices). NrEl entered the AEO 2015
reference and High Oil & Gas resource cases into reEDS, which took into account
regionally differentiated fossil fuel prices, availabilities, and seasonal adjustments for
−1
natural gas prices. Base gas prices increase from 2015 beginning at $5.01(PJ) ($4.75/
−1
mmBtu) to about $6.33(PJ) ($6/mmBtu) in 2030, while base gas prices decreased
−1
−1
from 2015 beginning at $5.01(PJ) ($4.75/mmBtu) to about $4.75(PJ) ($4.50/mmB-
tu) in 2030 (see Fig. 4.20) [28].
The study found that rE penetration is more sensitive to gas price than to the ITC, espe-
−1
cially when natural gas prices are as low as $4.75(PJ) ($4.50/mmBtu) (see Table 4.3) [28].
Utility-scale PV is shown to accelerate more rapidly in the early 2020s under the exten-
sion scenario, but reach the no extension scenario by 2030. The curve is steeper in the Base
Table 4.2 Schedule of Wind and Solar Tax Credits After the Consolidated
Appropriations Act of 2016 [28]
New Policy 2015 2016 2017 2018 2019 2020 2021 Future
Wind PTC Full Full 80% 60% 40% 0% 0% 0%
Solar ITC Utility 30% 30% 30% 30% 30% 26% 22% 10%
Commercial/Third- 30% 30% 30% 30% 30% 26% 22% 10%
party-owned
Residential host-owned 30% 30% 30% 30% 30% 26% 22% 0%
Prior policy 2015 2016 2017 2018 2019 2020 2021 2022
Wind PTC 0% 0% 0% 0% 0% 0% 0% 0%
Solar ITC Utility 30% 30% 10% 10% 10% 10% 10% 10%
Commercial/Third- 30% 30% 10% 10% 10% 10% 10% 10%
party-owned
Residential host-owned 30% 30% 0% 0% 0% 0% 0% 0%