
Page 73 - A Comprehensive Guide to Solar Energy Systems
P. 73
68 A COmPrEHENSIVE GUIDE TO SOlAr ENErGy SySTEmS
Start From
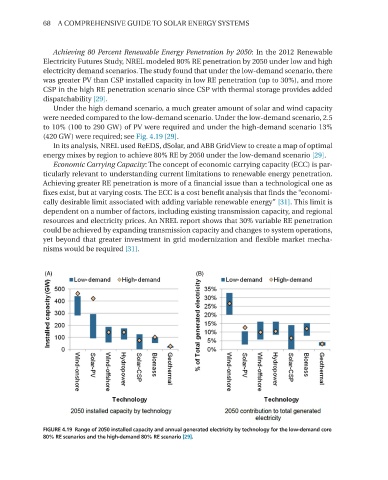
Achieving 80 Percent Renewable Energy Penetration by 2050: In the 2012 renewable
Electricity Futures Study, NrEl modeled 80% rE penetration by 2050 under low and high
electricity demand scenarios. The study found that under the low-demand scenario, there
was greater PV than CSP installed capacity in low rE penetration (up to 30%), and more
CSP in the high rE penetration scenario since CSP with thermal storage provides added
dispatchability [29].
Under the high demand scenario, a much greater amount of solar and wind capacity
were needed compared to the low-demand scenario. Under the low-demand scenario, 2.5
to 10% (100 to 290 GW) of PV were required and under the high-demand scenario 13%
(420 GW) were required; see Fig. 4.19 [29].
In its analysis, NrEl used reEDS, dSolar, and ABB GridView to create a map of optimal
energy mixes by region to achieve 80% rE by 2050 under the low-demand scenario [29].
Economic Carrying Capacity: The concept of economic carrying capacity (ECC) is par-
ticularly relevant to understanding current limitations to renewable energy penetration.
Achieving greater rE penetration is more of a financial issue than a technological one as
fixes exist, but at varying costs. The ECC is a cost benefit analysis that finds the “economi-
cally desirable limit associated with adding variable renewable energy” [31]. This limit is
dependent on a number of factors, including existing transmission capacity, and regional
resources and electricity prices. An NrEl report shows that 30% variable rE penetration
could be achieved by expanding transmission capacity and changes to system operations,
yet beyond that greater investment in grid modernization and flexible market mecha-
nisms would be required [31].
FIGURE 4.19 Range of 2050 installed capacity and annual generated electricity by technology for the low-demand core
80% RE scenarios and the high-demand 80% RE scenario [29].