
Page 94 - A Guide to MATLAB for Beginners and Experienced Users
P. 94
Special Effects 75
1
0.5
0
-0.5
-1
1
0.5 1
0.5
0
0
-0.5
-0.5
-1 -1
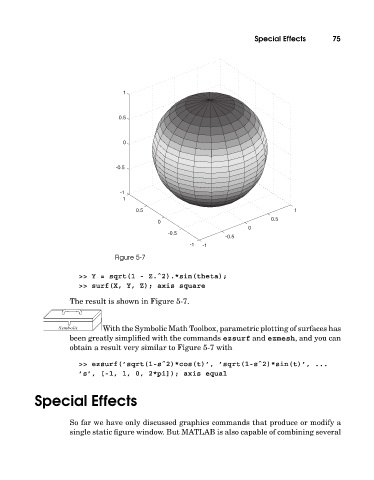
Figure 5-7
>> Y = sqrt(1 - Z.ˆ2).*sin(theta);
>> surf(X, Y, Z); axis square
The result is shown in Figure 5-7.
With the Symbolic Math Toolbox, parametric plotting of surfaces has
been greatly simplified withthe commands ezsurf and ezmesh, and you can
obtain a result very similar to Figure 5-7 with
>> ezsurf(’sqrt(1-sˆ2)*cos(t)’, ’sqrt(1-sˆ2)*sin(t)’, ...
’s’, [-1, 1, 0, 2*pi]); axis equal
Special Effects
So far we have only discussed graphics commands that produce or modify a
single static figure window. But MATLAB is also capable of combining several