
Page 92 - A Guide to MATLAB for Beginners and Experienced Users
P. 92
Three-Dimensional Plots 73
2
1.5
1
0.5
0
-0.5
-1
-1.5
-2
1
0.5 1
0.5
0
0
-0.5
-0.5
-1 -1
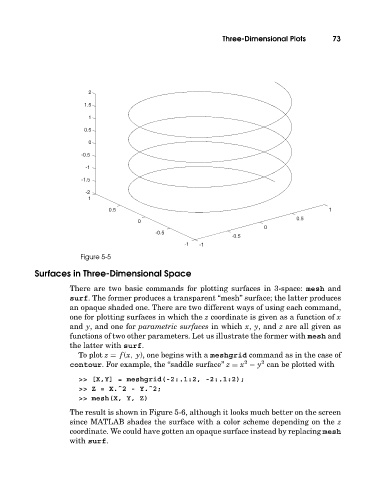
Figure 5-5
Surfaces in Three-Dimensional Space
There are two basic commands for plotting surfaces in 3-space: mesh and
surf. The former produces a transparent “mesh” surface; the latter produces
an opaque shaded one. There are two different ways of using each command,
one for plotting surfaces in which the z coordinate is given as a function of x
and y, and one for parametric surfaces in which x, y, and z are all given as
functions of two other parameters. Let us illustrate the former with mesh and
the latter with surf.
To plot z = f (x, y), one begins witha meshgrid command as in the case of
2
2
contour. For example, the “saddle surface” z = x − y can be plotted with
>> [X,Y] = meshgrid(-2:.1:2, -2:.1:2);
>> Z = X.ˆ2 - Y.ˆ2;
>> mesh(X, Y, Z)
The result is shown in Figure 5-6, although it looks much better on the screen
since MATLAB shades the surface with a color scheme depending on the z
coordinate. We could have gotten an opaque surface instead by replacing mesh
with surf.